Figure 8.
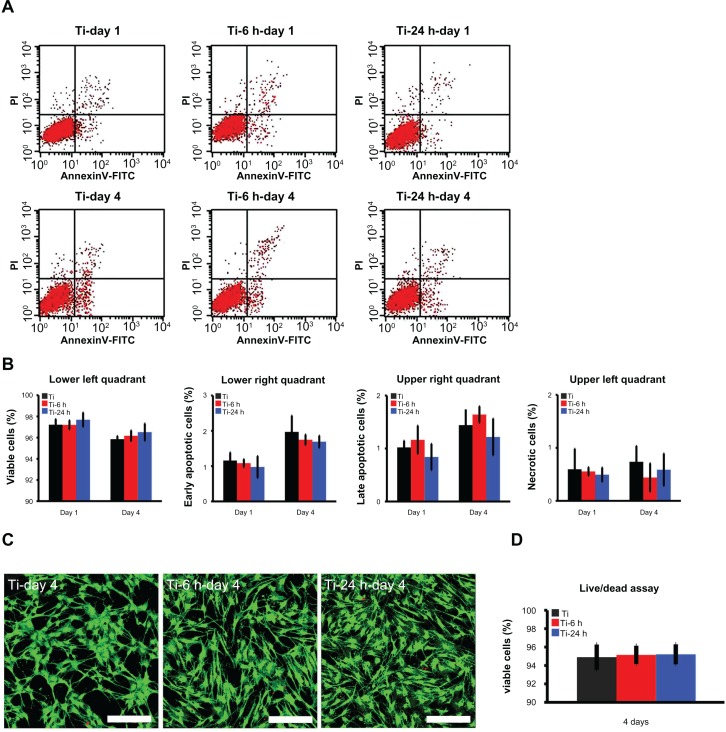
Cell viability assay. (A) Cellular apoptosis on different substrates were measured by flow cytometry at one and 4 days after culturing. Lower left quadrant represents viable cells, lower right quadrant represents cells at an early stage of apoptosis, upper right quadrant represents cells at a late stage of apoptosis, and upper left quadrant represents necrotic cells. (B) No statistically significant difference is found for apoptosis among the three groups at either time point. (C) After 4 days of culture, a live/dead assay was observed under the CLSM (scale bar, 200 μm), cytoplasm of viable cells is stained with green by DiOC18 and the nuclei of dead cells are stained with red by propidium iodide. (D) According to the statistical analysis of live/dead assay result, there are no statistically significant differences of the percentage of viable cells among the three groups.
Abbreviation: CLSM, confocal laser scanning microscope.

