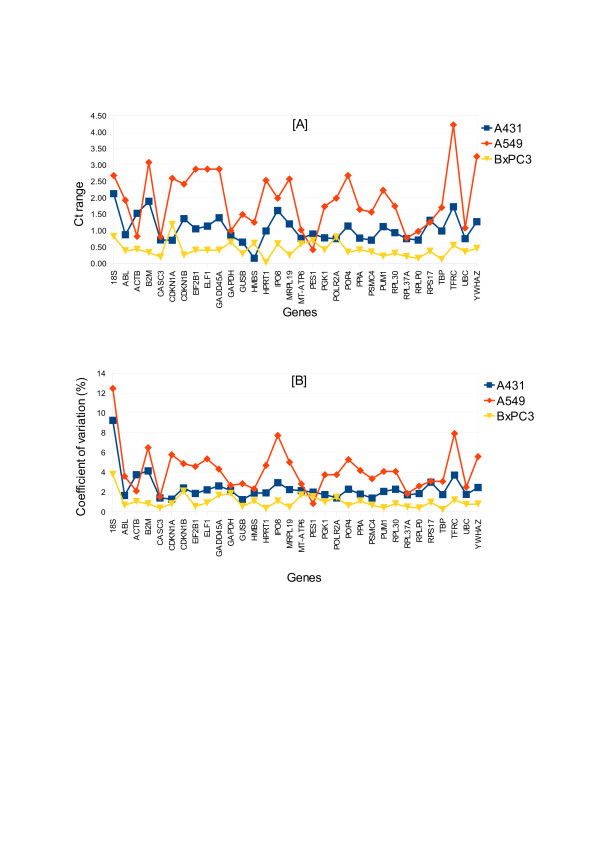
Figure 1.
Radiation induced variation in ECG expression. (A) CT range and (B) coefficient of variation Figure shows the variations in the expression level of each ECG in A431, A549 and BxPC3. BxPC3 showed least variation as a function of different radiation qualities as compared to A431 and A549. A549 showed highest variations.

