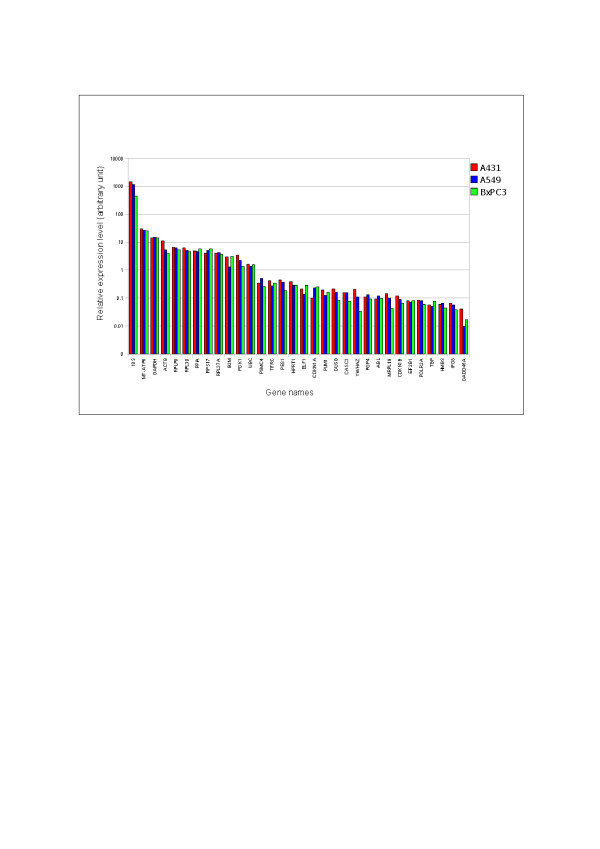
Figure 9.
Logarithmic histogram of the expression levels of 32 ECGs in all the cell lines. The 32 ECGs were normalized to the geometric mean of five control genes (RPLPO, UBC, TBP, PPIA and PSMC4). In A431, a 422-fold expression difference is observed between the most stable gene (PGK1) and the least stable gene (18 S), while in A549 and BxPC3, a fold difference of 530 and 375 respectively were observed between them. In addition it shows the cell line specific differences in expression levels of particular genes (e.g. YWHAZ).

