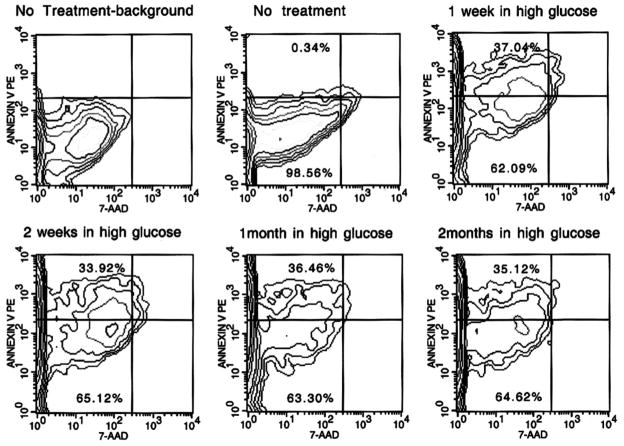
FIG. 8.
Flow cytometric analysis of apoptotic cells. Cells were cultured under high-glucose conditions for the indicated time periods, then collected for flow analysis. Intact cells were stained with Annexin-PE to detect outer-leaf phosphoserine, which is indicative of bilayer flipping and membrane blebbing in early apoptosis, and counterstained with the intercalating dye, 7AAD, to detect membrane permeability and chromatin degradation. Cells that stained with Annexin V but did not take up the 7AAD (upper left quadrant of each contour plot) were considered “apoptotic.” Cells that had background levels of Annexin V staining (set on untreated cell cultures, upper left panel) and no uptake of 7AAD were considered “viable and nonapoptotic.” The percentage of total cells (out of 10,000 detected events) in the “apoptotic” (upper left) quadrant and the “viable” (lower left) quadrant are given. PE, phycoerythrin

