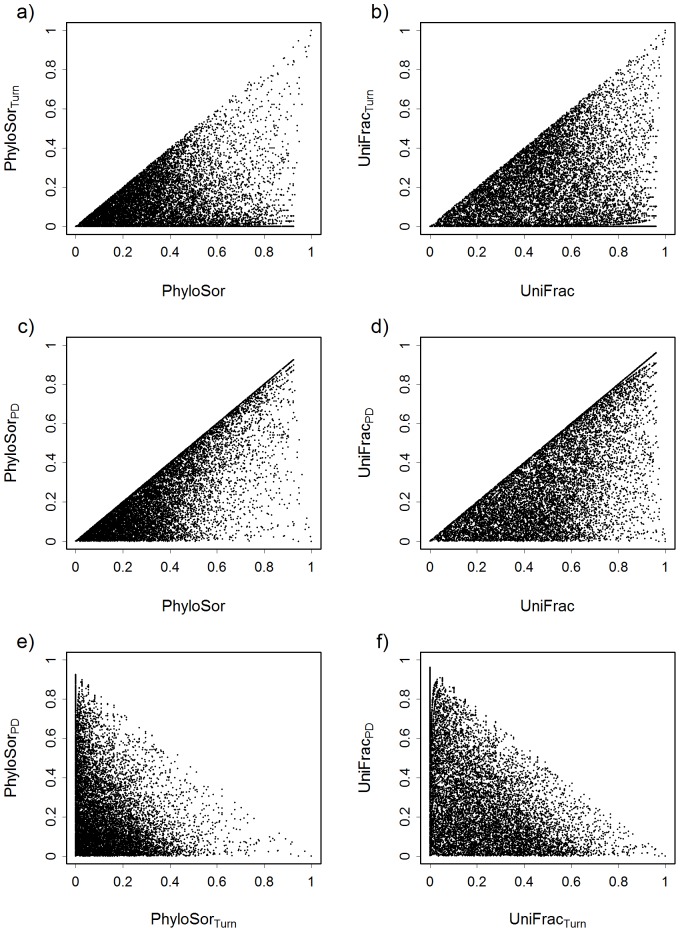
Figure 3. Relationships between phylogenetic beta diversity (PBD) and its turnover and phylogenetic diversity components.
These relationships are shown according to the PhyloSor index (a, c, e) and the UniFrac index (b, d, f). Values of PBD were calculated according to simulated communities (see main text for more details).

