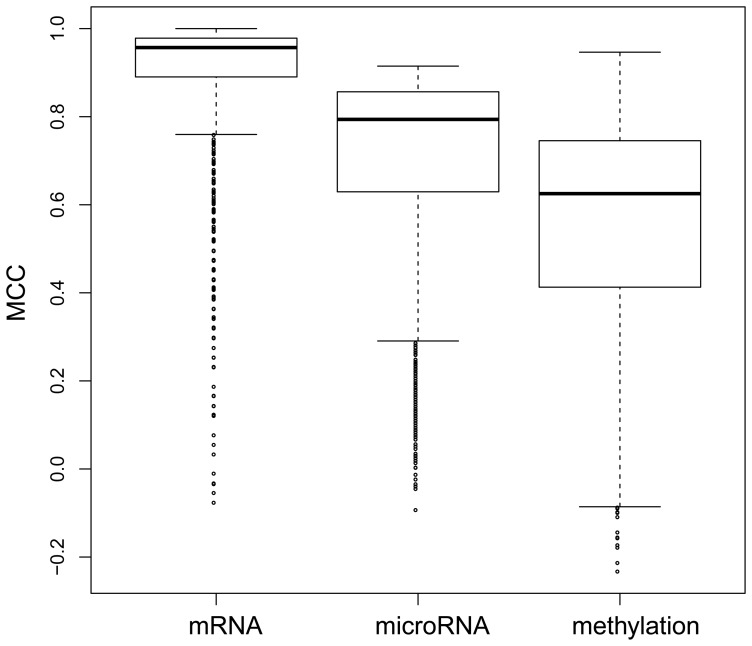
Figure 2. The MCC boxplot of methylation, microRNA and mRNA gene sets.
The mean MCCs of the mRNA, microRNA and methylation gene sets were 0.897, 0.702 and 0.561, respectively. The MCCs of the mRNA sets were significantly greater than the MCCs of the microRNA sets with a one-sided t-test p-value of less than 2.2e-16, and the MCCs of the microRNA sets were, in turn, significantly greater than the MCCs of the methylation sets with a one-sided t-test p-value of less than 2.2e-16.

