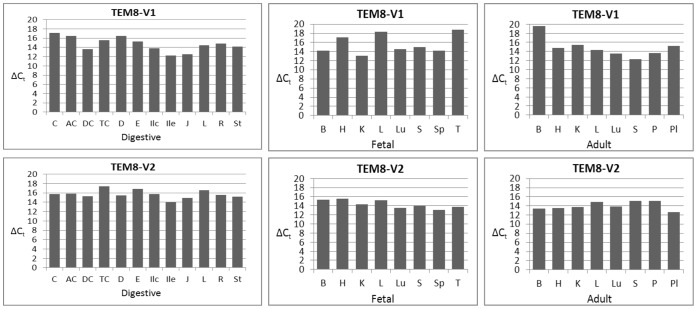
Figure 8. Quantitative analysis of TEM8 splice variants V1 and V2.
The analysis was carried out according to the real-time PCR protocol in Figure 7, and as described in Materials and Methods. ΔCt values are the averages of two independent real-time PCRs, calculated by subtracting the Ct values for each variant from the Ct values for β-actin. Digestive tissue panel: C, cecum; AC, ascending colon; DC, descending colon; TC, transverse colon; D, duodenum; E, esophagus; Ilc, ileocecum; Ile, ileum; J, jejunum; L, liver; R, rectum; St, stomach. Fetal and adult tissue panels: B, brain; H, heart; K, kidney; L, liver; Lu, lung; P, pancreas; Pl, placenta; S, skeletal muscle; Sp, spleen; T, thymus.

