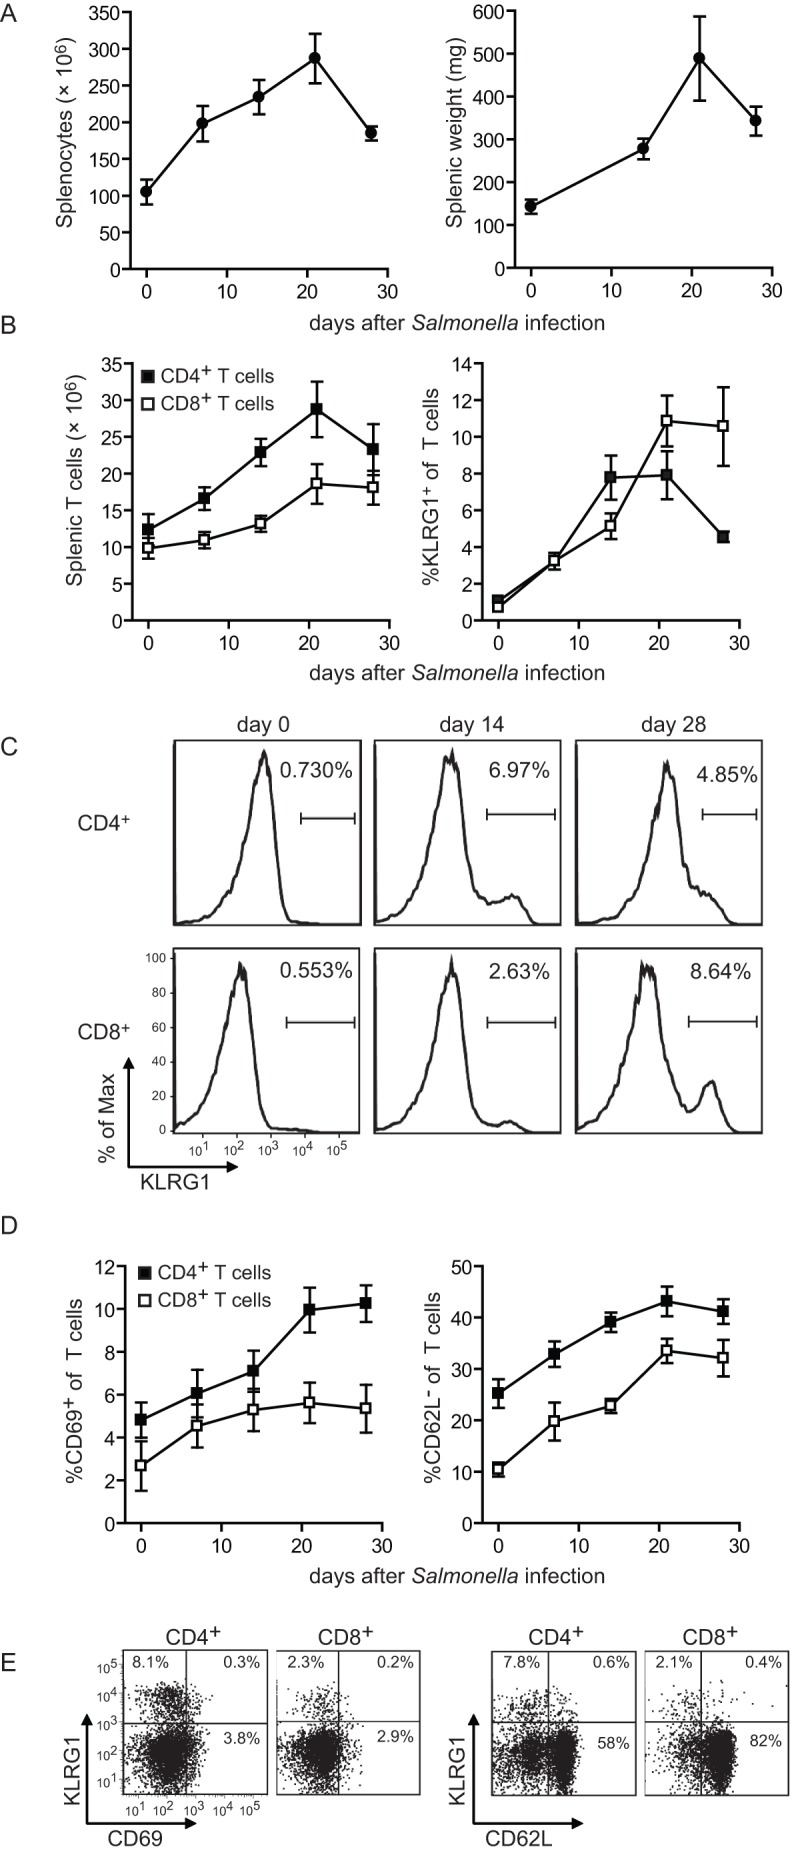
Figure 1. Salmonella infection induces splenomegaly and activation of T cells.

C57BL/6 mice were infected orally with 1×10⁷ virulent Salmonella Typhimurium (strain LT2). At day 7, 14, 21 and 28 post-infection, (A) the total number of splenocytes and the splenic weight were determined. (B) Graphs show the total number of splenic CD4+ (Foxp3−) and CD8+ T cells and the percentage of KLRG1 within these populations over time. Data are shown as mean ± SEM of 5–7 mice per timepoint. (C) Representative histogram plots show the KLRG1 expression on splenic CD4+ (Foxp3−) and CD8+ T cells at the indicated timepoints post-infection. Numbers indicate the percentage of KLRG1+ cells within the CD4+ (Foxp3−) or CD8+ T cell population. (D) Graphs show the percentage of CD69+ and CD62L− within the CD4+ (Foxp3−) and CD8+ T cell populations over time. Each data point shows mean ± SEM for 5 mice per group. (E) Representative dot plots show the KLRG1 versus CD69 or the KLRG1 versus CD62L expression on splenic CD4+ (Foxp3−) and CD8+ T cells at day 14 post-infection. The percentage of positive cells within each quadrant is indicated. Experiments were performed twice with similar results.
