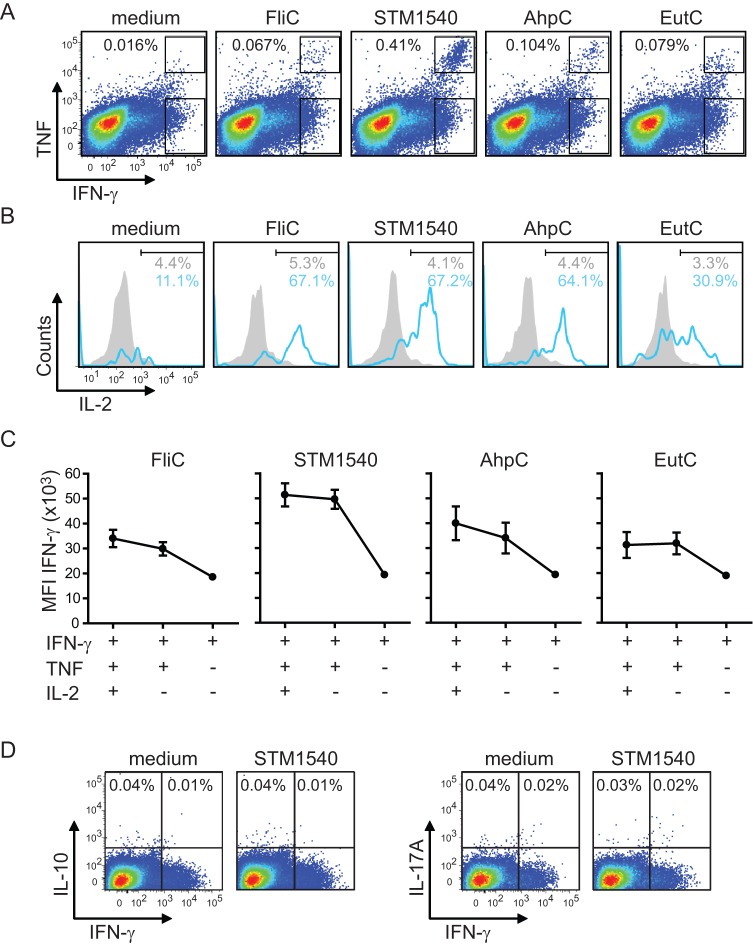
Figure 5. Development of polyfunctional CD4+ T cell responses during Salmonella infection.
C57BL/6 mice were infected orally with 1×10⁷ virulent Salmonella Typhimurium and at day 14 post-infection the cytokine profiles of Salmonella-specific CD4+ T cells were determined by polychromatic flow cytometry. (A) Shown are representative analyses of the IFN-γ and TNF cytokine profiles gated on CD3+CD4+ T cells, which were stimulated with dendritic cells that were either loaded with peptides (i.e. FliC429–443, STM1540262–276, AhpC154–168 or EutC243–257) or not loaded with peptide (medium). The percentage of IFN-γ+TNF+ within the CD3+CD4+ T cell population is indicated. (B) Histogram plots show the percentage of IL-2 positive cells within the double IFN-γ+TNF+ (blue line) and single IFN-γ+ (filled grey histograms) population. (C) Shown is the IFN-γ mean fluorescence intensity (MFI) ± SEM of epitope-specific triple IFN-γ+TNF+IL-2+, double IFN-γ+TNF+ and single IFN-γ+ CD3+CD4+ T cells. (D) Shown are representative analyses of the intracellular IL-10, IL-17A and IFN-γ expression of CD3+CD4+ T cells, which were stimulated with dendritic cells that were loaded with STM1540262–276 peptide or not loaded with peptide (medium). The numbers indicate the percentage of cells that are positive for the indicated cytokines in each quadrant. Four independent experiments were performed with four mice per experiment.

