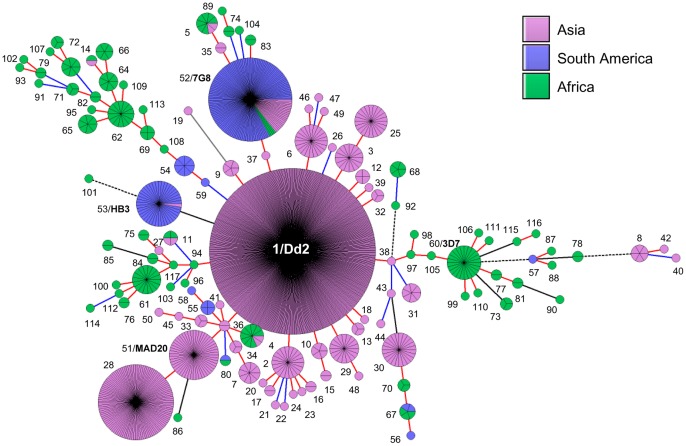
Figure 4. Global population structure of csp gene.
A minimal spanning tree (MST) generated using BioNumerics software version 6.6 showing the relationship among all the 117 haplotypes based on the Th2R/Th3R sequences of the CSP from worldwide isolates [Asia, n = 974; South America, n = 181 and Africa, n = 184)]. Each circle represents an individual haplotype and the size of the circle is proportional to the number of isolates belonging to that haplotype (also shown as pie). The lines connecting the circles are branch length and are red if two haplotypes differ by only one mutation, blue if differ by 2 mutations, solid black if differ by 3 mutations, dashed black if differ by 4 mutations and gray if they differ by more than 4 mutations. Numbers outside the circles indicate haplotypes H1 to H117. The Dd2, 3D7, HB3, 7G8 and MAD20 type sequences are highlighted in bold. The haplotype pairs H55 & H58; H57 & H87; H60 & H106 and H97 & H98 are identical at amino acid level; but have one synonymous mutation. H1 to H24 are the same haplotypes we observed in our study sites and shown in Fig 3B . Please refer to Table S1, Table S3 and Fig S1 for more details on these sequence haplotypes and their country-wise distributions.

