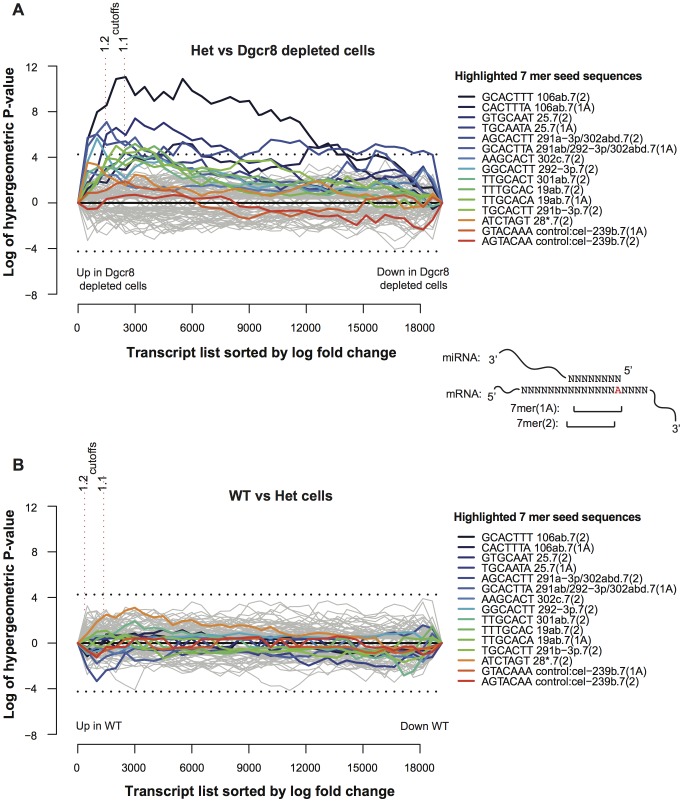
Figure 2. Sylamer plots of miRNA seed enrichment amongst genes whose expression changes following Dgcr8 depletion.
A) Heterozygote vs. Dgcr8-depleted cells. Independent homozygous mutant and heterozygous cell lines are considered replicates. Array probes and associated transcripts were sorted according to log fold change in Dgcr8gt1/tm1 and Dgcr8 gt2/tm1 cells compared to Dgcr8tm1,gt1/+and Dgcr8 tm1,gt2/+ cell lines (see Materials and Methods). These lists were used for Sylamer analysis. The x-axis represents ordered transcripts possessing a 3′ UTR sequence. Up-regulated transcripts in the homozygous mutant cells are to the left and down-regulated to the right. Each grey line represents enrichment or depletion of individual miRNA 7mer seeds in 3′ UTRs to the left of a data point relative to the right of the data point. Positive scores on the y-axis indicate probes to the left of this point are associated with enrichment of seed sequences. Negative scores indicate depletion. Seed sequences of particular interest are highlighted in colour. Each highlighted seed sequence is annotated with numbers corresponding to associated miRBase miRNAs (eg. 106), letters representing corresponding miRNA family members (eg. ab) and the seed sequence type (eg. 7(2)). Enrichment and depletion is tested at progressive intervals of 500 transcripts. Red vertical dotted lines indicate a fold change cut off. Horizontal black dotted lines represent a Bonferroni-corrected P-value threshold of 0.01. B) An equivalent analysis comparing the expression of WT cells to Heterozygote cells. For this analysis, Dgcr8gt1/tm1 and Dgcr8 gt2/tm1cells were considered as replicates and compared to their WT cell line.

