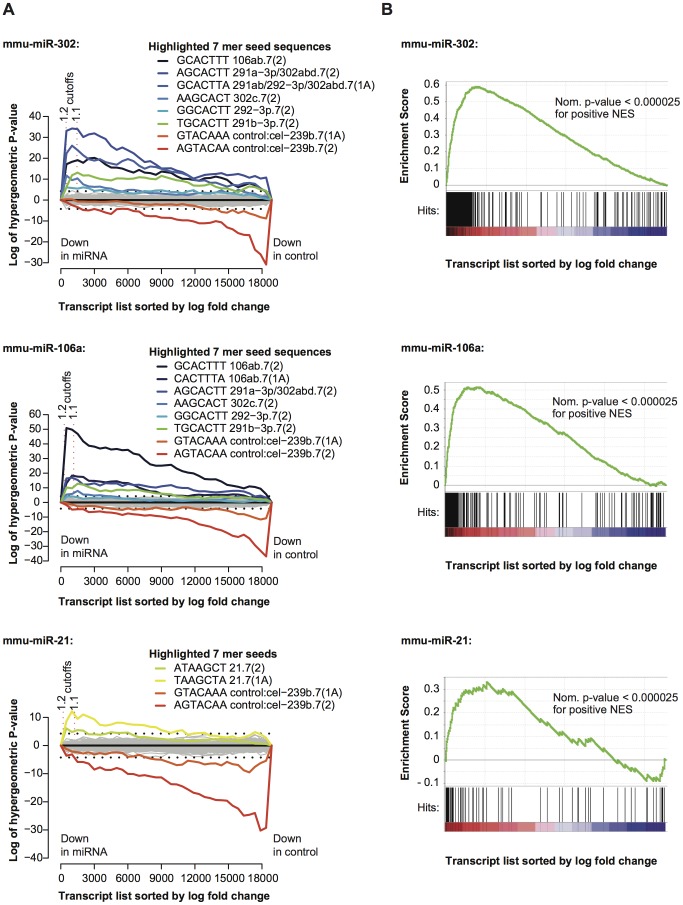
Figure 3. The use of global expression profiles to determine miRNA-dependent transcriptional effects.
A) Sylamer analysis of expression profiles following the transfection of miRNA mimics into Dgcr8 gt1/tm1 cells. Array probes and associated transcripts were ordered according to their log fold change in those cells transfected with a miRNA mimic (miR-302a, miR-106a, and miR-21) when compared to those transfected with a control duplex (cel-miR-239b). These lists were then subjected to the Sylamer analysis (See Figure 2 for a description of Sylamer plots). Transcripts relatively down regulated in the cells transfected with the test miRNAs are to the left, while those relatively down-regulated in the controls are to the right. B) GSEA enrichment plots [29] depicting the enrichment of the transcripts within the miRNA target lists for miR-302a, miR-106a and miR-21 within regions of a list of transcripts ordered according to expression following the depletion of Dgcr8. The relative expression of transcripts in heterozygous cell lines compared Dgcr8-depleted cell lines is plotted on the x-axis, ordered according to log fold change, with those genes up-regulated in homozygous mutant cell lines to the left. Black lines on the horizontal axis represent the positions of the miRNA targets within the ordered transcript lists. The green line represents the “running” enrichment score at each position progressing through the gene list. If the maximum deviation of the “running” enrichment score from 0 is positive this implies an enrichment of miRNA targets amongst those genes up-regulated in the Dgcr8-depleted cells. Conversely if the maximum deviation is negative the targets are relatively enriched amongst down-regulated genes.

