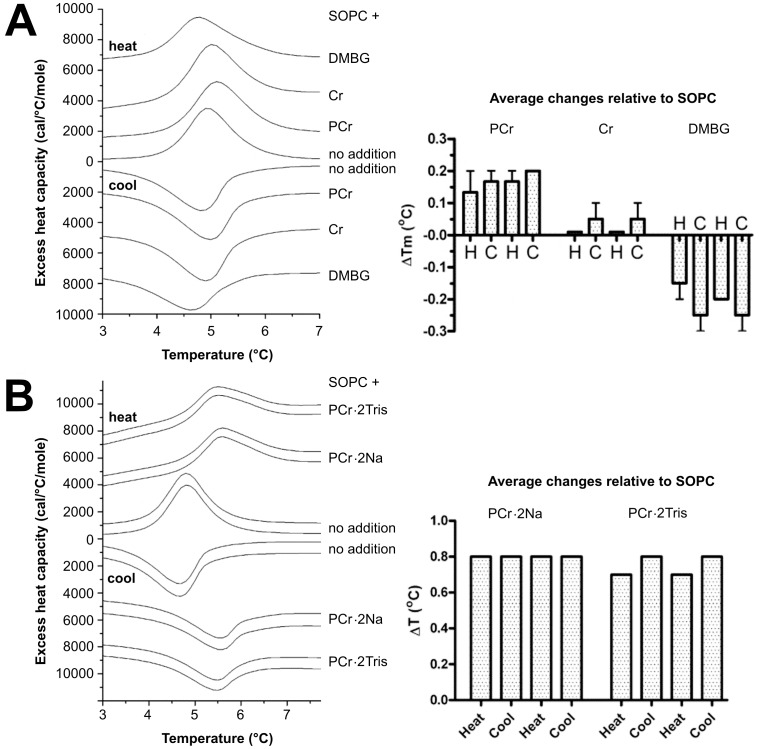
Figure 4. Effect of phosphocreatine, creatine and dimethylbiguanidium chloride on the lipid phase transition as determined by differential scanning calorimetry.
Thermograms (left) and quantified phase transition temperature shifts (right) obtained by heating or cooling of a suspension of SOPC in PIPES buffer (20 mM PIPES pH 7.4, 140 mM NaCl, 1 mM EDTA) alone (middle scans in A or B, labeled (−). (A) one heating and one cooling scan shown with added 100 mM PCr, Cr or dimethylbiguanidium chloride (DMBG), or (B) two cycles of heating and cooling shown for each sample. 500 mM PCr Na-salt or Tris-salt (omitting NaCl). Thermograms (left) are from representative runs, histograms (right) represent averaged data from 3 independent experiments (H = heating; C = cooling).

