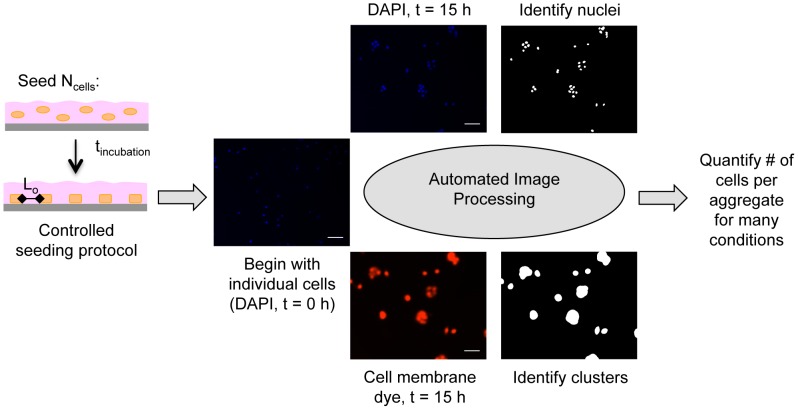
Figure 4. Techniques for quantifying aggregate size.
Ncells (0.8–2.6×10⁴ cells/cm2) were seeded onto Ln-coated substrata and allowed to adhere for tincubation (1–3 hours). Non-adherent cells were then rinsed away such that only individual, substratum-attached cells remained at t = 0 h. Ncells and tincubation were optimized for each Ln coating concentration such that the initial mean intercellular spacing (Lo) was ∼108 µm for all substrata. Aggregate sizes at t = 0 h and t = 15 h were determined from fluorescence images of DAPI-labeled nuclei and membrane dye-labeled clusters using thresholding and edge detection algorithms in MATLAB. The number of nuclei contained within each cluster was determined using MATLAB, providing a rigorous and high throughput method for quantifying aggregate sizes.

