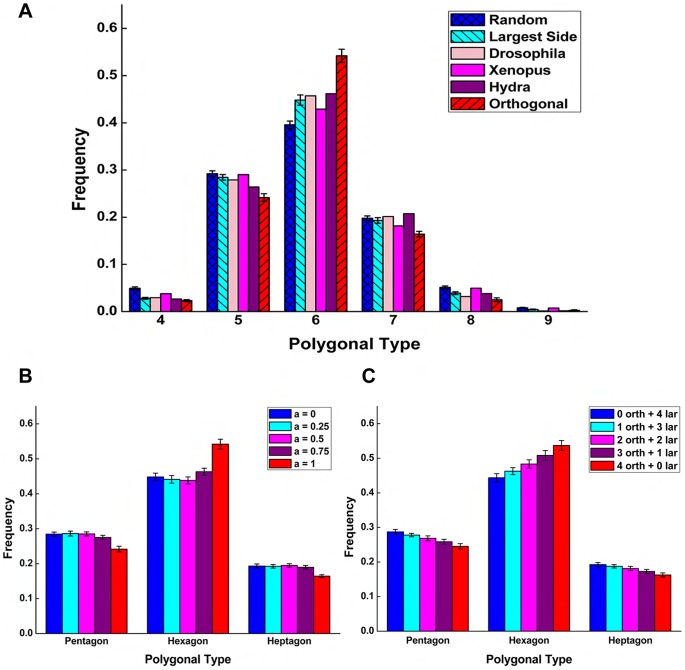
Figure 3. Simulations of topological distributions in proliferating epithelia.
(A) The largest side division plane orientation agrees with animal tissues with a peak of around 45% hexagons. Random division plane orientation produces a flatter distribution with a lower percentage of hexagons (40%). Orthogonal division plane orientation generates a distribution with a higher percentage of hexagons (55%). (B) Mitotic cells divide through orthogonal scheme with probability  ,
,  . The probability of a cell using orthogonal scheme in division for all its ancestors is
  ,
,  . It is close to 0 for
  , 1 for
  . There is no correlation between the topological distribution and different value of
  . (C) Different combinations of cell types are set initially. Orthogonal cells divide successively using the orthogonal scheme. Topological distribution is linearly correlated to the proportion of initial orthogonal cells.

