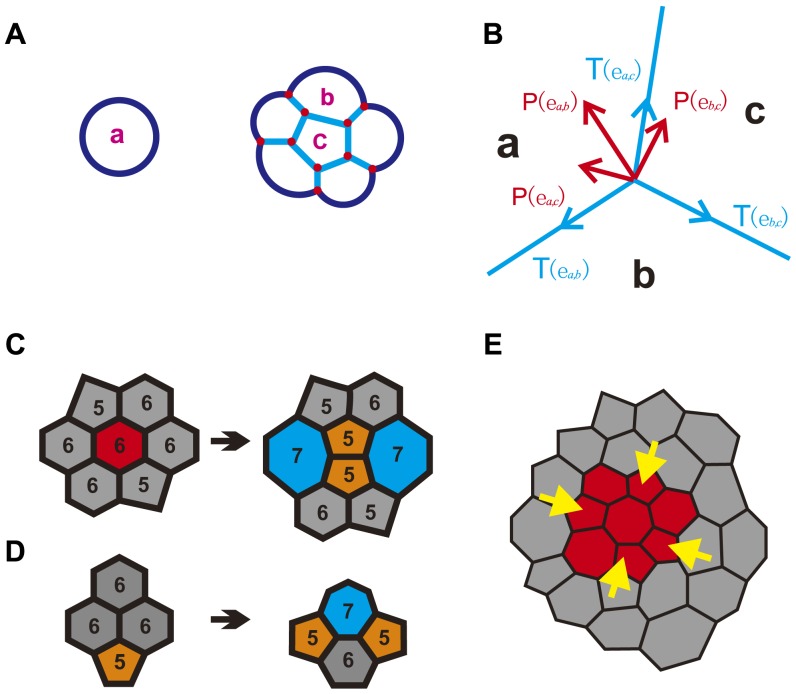
Figure 5. Cellular model for simulations of cell topology.
(A) Geometric representation of cells. Cell a, in isolation, is modeled as a disk. Cell b, at the boundary of a tissue, is modeled as a disk segment. Cell c, completely surrounded by other cells, is modeled as a polygon. Inner edge (light blue) is a straight line segment, and outer edge (dark blue) is an arc or a circle. Vertex (red dot) is the junction point of three edges. (B) Mechanical forces acting at the junction vertex of three cells a, b, and c. Tension is tangential to the edge (blue). Pressure is normal to the edge (red), from the cell with higher pressure to the cell with lower pressure. (C) Cell topology is affected by cell division. After division of the mitotic cell (red, hexagon), daughter cells (orange, pentagon) lose sides on average (5 6). Two neighboring cells gain one side each (blue, heptagon), leading a transition from hexagon to heptagon. (D) Cell topology is affected by cell rearrangement. Three hexagons (gray) and one pentagon (orange) transfer to one hexagon (gray), one heptagon (blue), and two pentagons (orange). The distribution of cell polygonal types changes. (E) Epithelial tissue with differential proliferation. Internal proliferating cells (red) grow outward, pushing the outside quiescent cells (gray). Outside quiescent cells tend to stay at their original positions, compressing the inner proliferating cells (yellow arrows).

