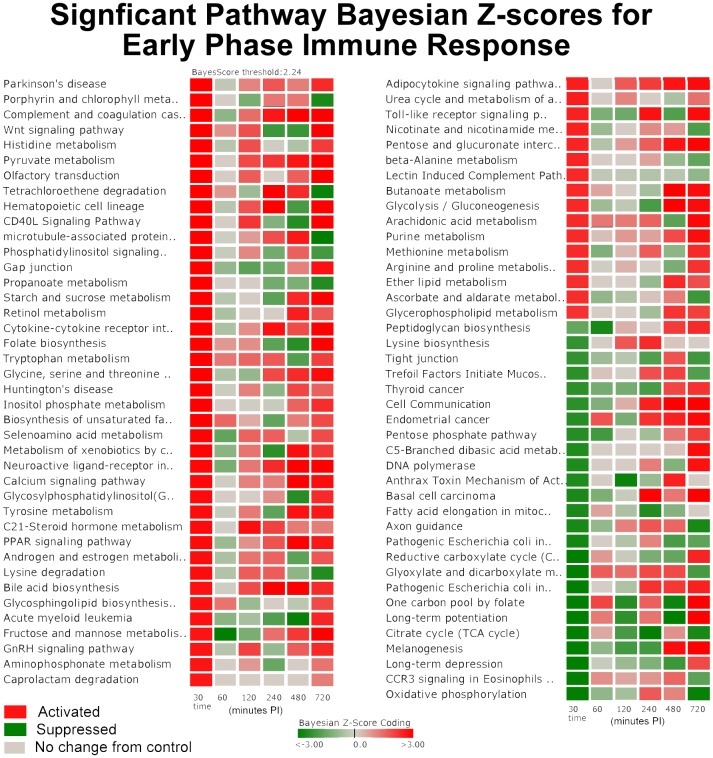
Figure 1. Significantly Perturbed Pathways of the Early Phase Immune Response.
The darker red gradients indicate higher activation scores (more up-regulated gene expression within the pathway) while the darker green gradients indicate more suppressed pathway activity (more down-regulated gene expression) of MAP infected Peyer's patch. The pathway threshold score was selected for a 97.5% confidence.

