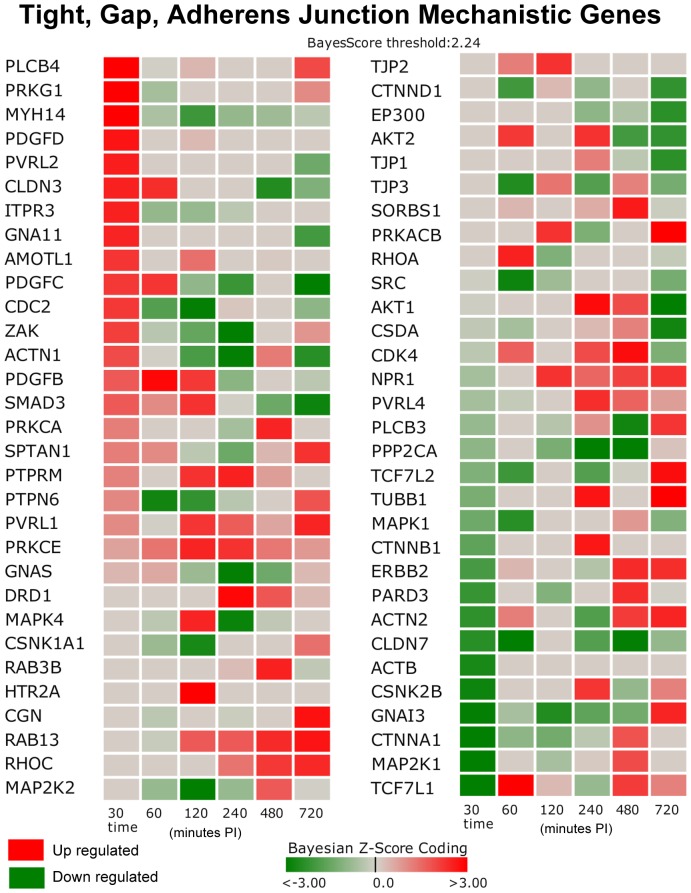
Figure 4. Heat Map of Mechanistic Genes for Junction (Adherens, Gap, and Tight) Related Pathways. The junction related mechanistic genes determined significant by DBGGA analysis.
The heat map shows a dominance of down regulated junction related gene expression occurring in the Early Phase as indicated by the darker green boxes. Genes listed surpassed the |Bayesian z-score|>2.24 at any of the time points. Red indicates up regulation while green indicates down regulation. Time is minutes post-infection.

