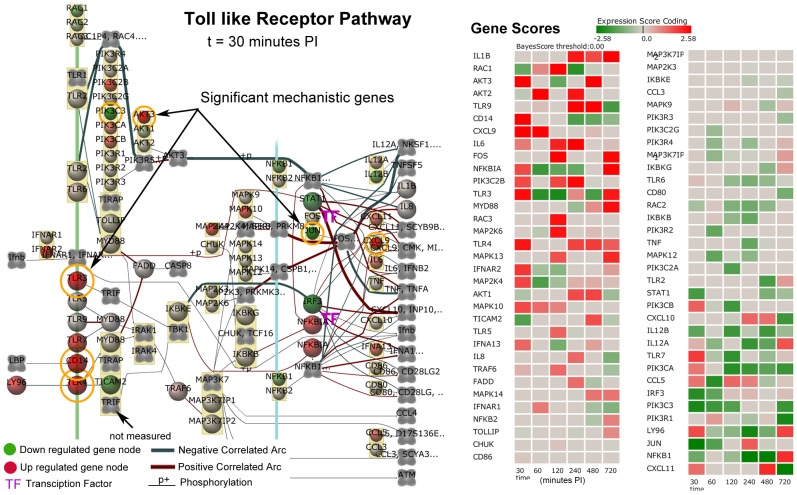
Figure 6. Toll-like Receptor Signaling Pathway.
Toll-like receptor signaling pathway Bayesian network representation at 30 min post-infection (left), and the DBGGA scores for the gene expression of MAP infected host Peyer's patch versus non-infected controls (right). Gene nodes with orange circles on the network are those defined as mechanistic genes that surpass a threshold |Bayesian z-score|>2.24. The network shows gene nodes with gradient colors representing the level of expression (deeper red for higher up-regulated genes and deeper green for down-regulated). The heat map is colorized and corresponds to the gene node expression levels. Grey color represents little to no expression difference between MAP infected and controls. The heat map columns are by time post-infection in minutes.

