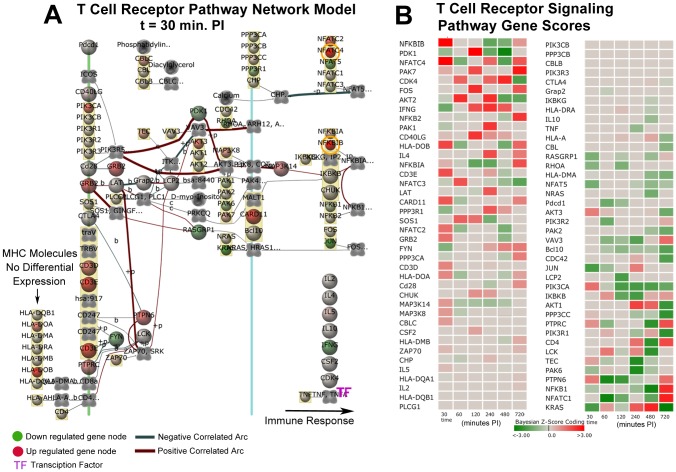
Figure 8. T-Cell Receptor Signaling Pathway Network Model and T-Cell Signaling Pathway Scores.
The model (a) and the heat map (b) indicate an overall lack of differential expression that reflects a defective host immune response state to MAP in bovine Peyer's patch. A defective antigen processing and presentation by MHC class II molecule and lack of immune response is readily evident by examining the network (a) and the Bayesian z-score heat map (b).

