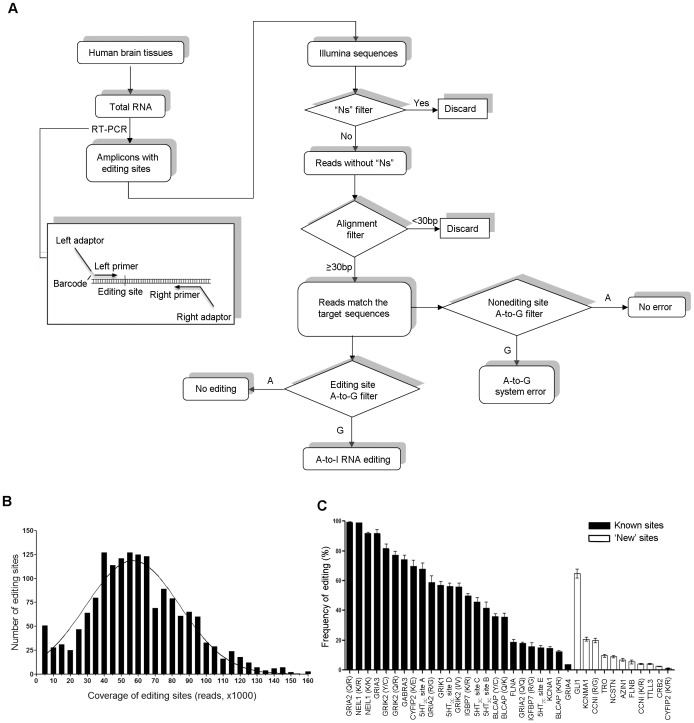
Figure 1. Ultra-high-throughput sequencing of potential A-to-I RNA editing sites.
A. Shows a schematic diagram of processing and measuring RNA editing using ultra High Throughput Sequencing technology. B. Shows the frequency distribution of sequencing coverage for each editing site. The reads for each editing site from three sets of normal human brain samples were grouped in intervals of 5,000 reads. Using the D’Agostino-Pearson normality test, the data do not differ significantly from a Gaussian distribution. C. Shows the A-to-I RNA editing frequency of 36 sites from category I, including 11 ‘new’ sites and 25 known sites in three sets of normal human samples. RNA editing frequency is presented as mean, expressed as a percentage of the total population of transcripts, ± SEM.

