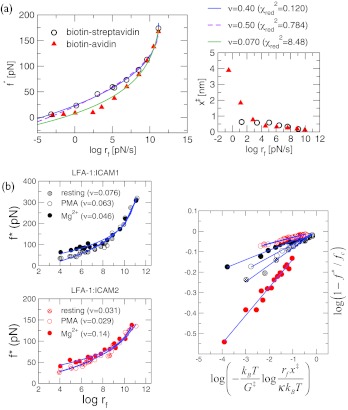
Figure 3.
Analysis of DFS data with large curvatures. (a) The data obtained using biomembrane force probe (BFP) with force constant in the range 0.1–3 pN/nm (Ref. 14) were fitted to Eq. 5 (solid lines) with ν = 0.40 for biotin-streptavidin (circle) and ν = 0.070 for biotin-avidin (triangle). The x‡(rf) at each rf is calculated on the right using the slope of four successive data points of [f*, log rf] plot. Analyses of data using restricted ν values (ν = 0.5 fit is in dashed line in Fig. 4a). (b) Analysis of DFS data of LFA-1 and its ligands, ICAM-1 and ICAM-2 in Ref. 16. The fits in log-log scale are shown on the right. In all cases, ν < 1/2 suggests that for these complexes as well the underlying free energy profiles must contain at least two barriers; thus multi-state fits are required by dividing the DFS data into multiple regions as was already surmised in Ref. 16.

