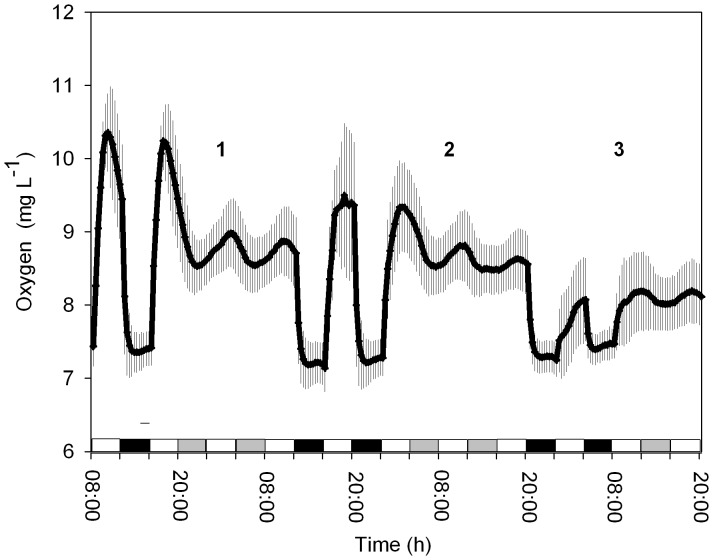
Figure 1. Oxygen evolution during the LD cycle at 3 different light intensities followed by LL cycles.
1) 100 µmol quanta m−2 s−1, 2) 75 µmol quanta m−2 s−1 and 3) 40 µmol quanta m−2 s−1. White bars indicate the light period, black bars the dark period and grey bars subjective darkness (Each time point N = 4, ±S.D.).

