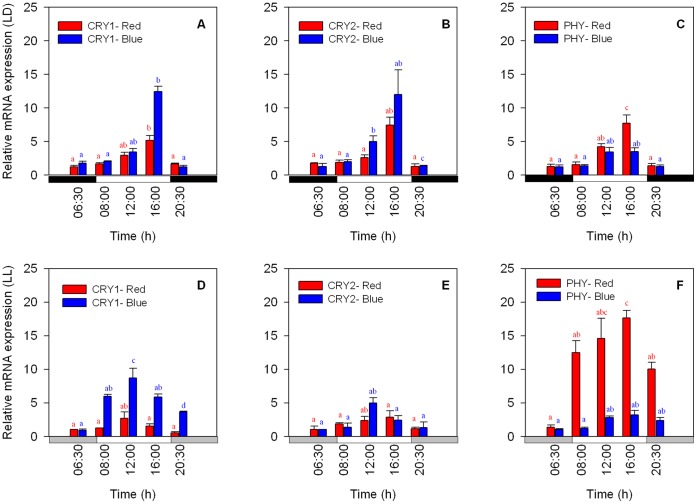
Figure 5. Expression of mRNA as determined by qPCR analysis of the putative CRY1, CRY2 and PHY genes.
A–C) LD cycle, 12∶12 h (8∶00–20∶00); D–F) LL cycle. White bars indicate the light period, black bars the dark period and grey bars subjective darkness (Each time point N = 3, ±S.D.). Significantly different groups from one-way ANOVA followed by Tukey’s HSD test are shown with different letters (a, b, ab, c and d) (P<0.05).

