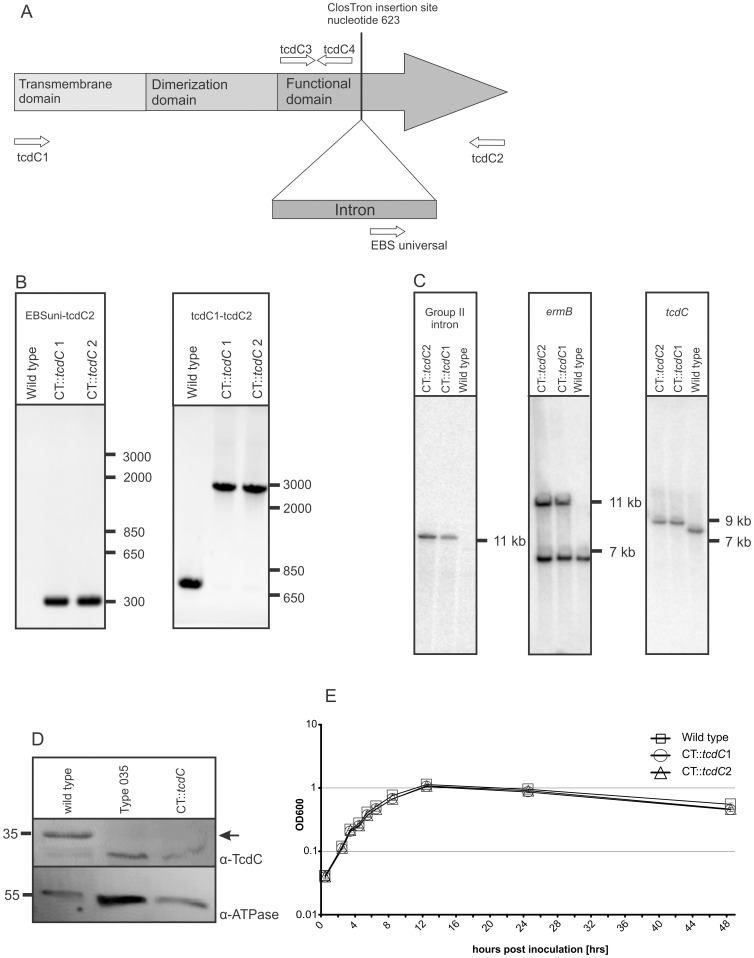
Figure 1. Characterization of the C. difficile tcdC mutant.
(A) Schematic representation of 3 different domains of TcdC and the intron insertion site for the inactivation of TcdC. The arrows in the putative repressor domain represent the locations and orientation of the primers used in the RT-q-PCR and conventional control PCRs. (B) PCR confirmation of the wild type strain and the CT::tcdC mutant. The primer EBS universal and tcdC2 generated a PCR product of 302 bp for the CT::tcdC strains. Primers tcdC1 and tcdC2 generated a 699 bp PCR product for the wild type and for the CT::tcdC strain a PCR product of circa 2800 bp. (C) Southern blot analysis of EcoRV digested genomic DNA of wild type and CT::tcdC strains with a Group II intron, ermB gene and tcdC specific probes. Note that probing with the ermB probe results in 2 bands for the CT::tcdC strains, since wild type already carries a copy of the ermB gene in the genome [35]. (D) Western blot analysis of TcdC production in wild type and CT::tcdC strain 8 hours post inoculation. The arrow indicates the location of TcdC protein based on MW and absence of the protein in the PaLoc negative Type 035 strain. Note that cross-reaction of TcdC antibody with a protein of similar MW was also observed in Carter et al. [30]. (E) Growth curves of C. difficile 630ΔErm and C. difficile CT::tcdC mutant strains. The absorbance (OD600) was measured over 48 hrs of growth in TY medium. The error bars indicate the standard error of the mean of six experiments.

