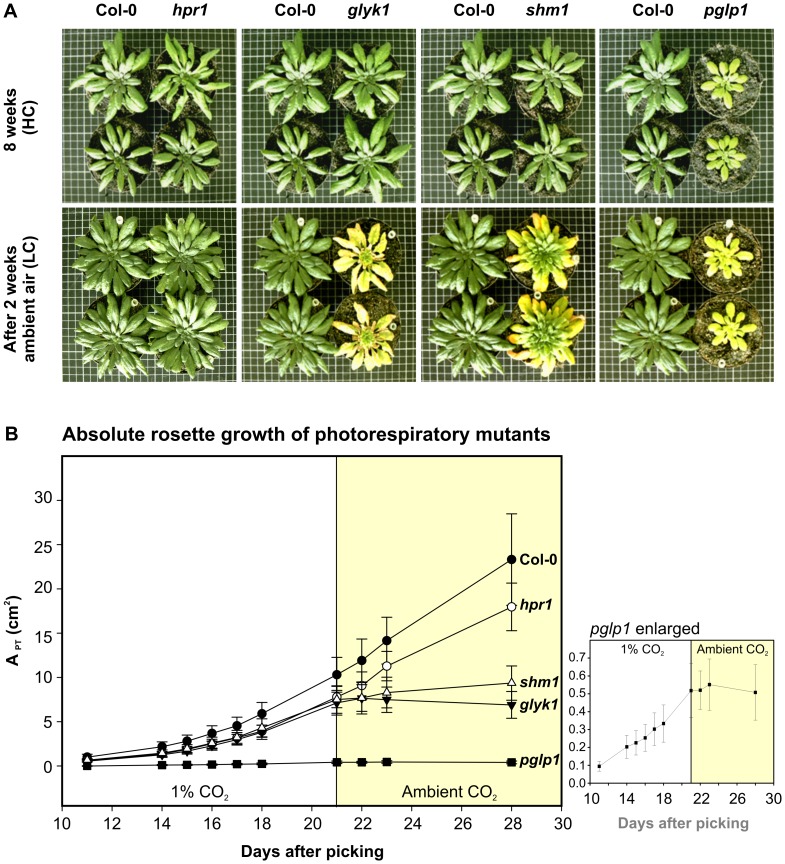
Figure 1. Phenotypes and growth performances at high CO2 and after transition to ambient air.
(A) Plants were first grown in 1% CO2 (HC) for eight weeks to stadium 5.1 [25], then transferred to ambient air (LC; 0.038% CO2) and monitored for another 2 weeks. For more detailed time courses see Figure S1 and Figure S2. (B) Absolute rosette growth rates of photorespiratory mutants before and after transfer to LC. Shown is the projected rosette area (APT) as calculated from automated image acquisition and analysis using the phenotyping platform GROWSCREEN FLUORO. Plants were transferred to LC before reaching stadium 5.1 to allow comparability with the DISP-based growth analysis (shown in Figure 5) of young developing leaves before and after transfer. Monitoring started 11 days after picking for a period of 10 days in HC conditions (stadium 1.04). Next, plants were transferred to LC and monitored for another 7 days. Data points represent mean values ± SD from 8 individual plants.

