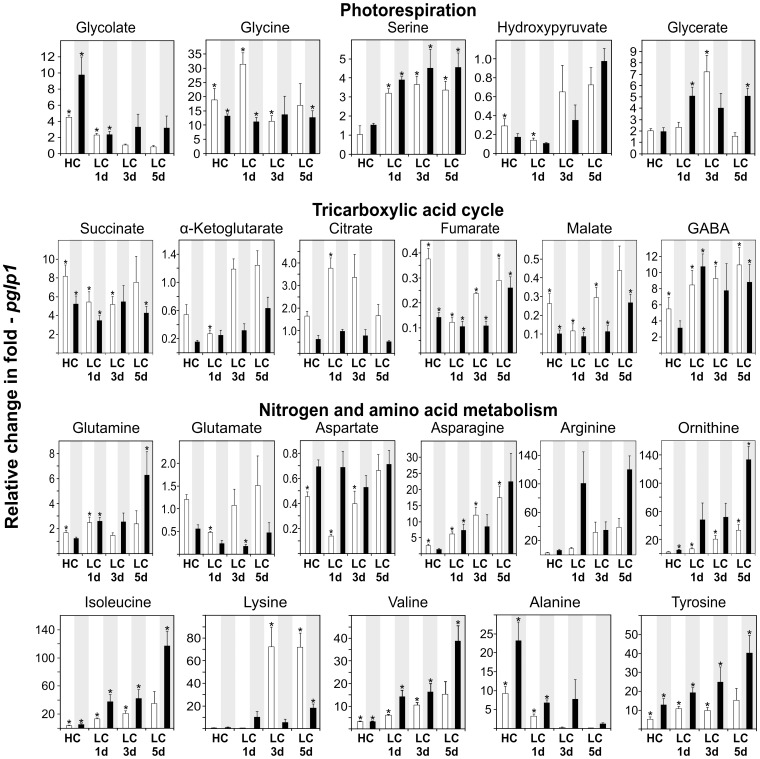
Figure 8. Metabolite responses of pglp1 after transition to ambient air.
Relative metabolite contents ± SD are shown with the corresponding wild-type content at HC arbitrarily set to 1 (white bars, day values; black bars, night values). See the legend of Figure 6 for more experimental details and Table S3 for the full data set.

