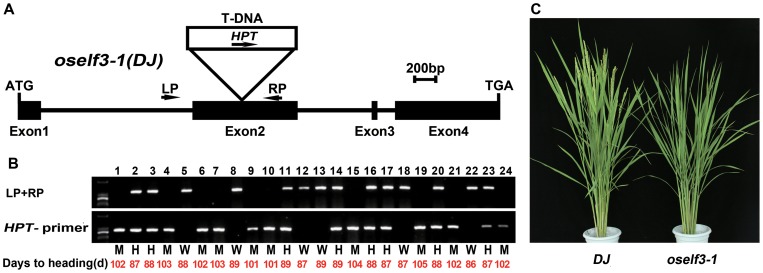
Figure 1. Schematic diagram of OsELF3-1 gene structure, the T-DNA insertion site and oself3-1 phenotype.
(A) Schematic diagram of OsELF3-1 gene structure and the T-DNA insertion site. Filled boxes indicate exons and solid lines indicate introns. Arrows indicate the primers used for analyzing the insertion site. LP and RP respectively represent the primers around the left and right borders of the T-DNA. (B) PCR genotyping of OsELF3-1 segregants. W, wild type; M, homozygous; H, heterozygous. (C) Phenotypes of wild type and oself3-1. Photograph was taken when WT plant (Dongjin) flowered.

