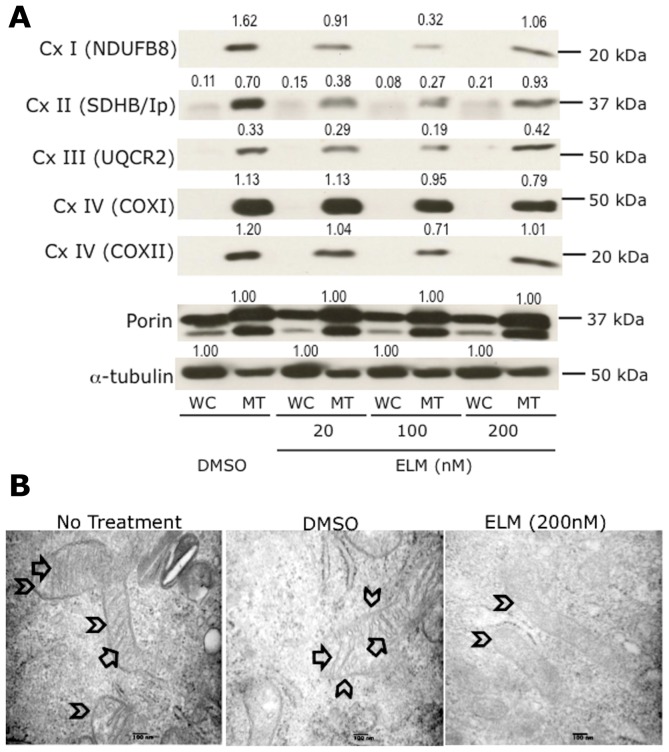
Figure 3. Impact of Elesclomol treatment on mitochondria.
(A) Immunoblot analysis of whole-cell (WC) and mitochondrial (MT) lysates obtained from WM1158 cells that had been treated with Elesclomol (ELM) for 4 hr. The blots were probed with antibodies to various subunits that are part of complex I–IV of the mitochondrial respiratory chain. Signal intensity of the respective protein bands was normalized to α-tubulin (WC) and likewise, Porin (MT; two protein bands) using ImageJ imaging processing software. Abbreviations: NDUFB8-NADH dehydrogenase (ubiquinone) 1 beta subcomplex 8; SDHB/Ip-succinate dehydrogenase complex, subunit B, iron sulfur; UQCR2-ubiquinol-cytochrome c reductase core protein II; Sub 1-cytochrome c oxidase subunit 1; Cox II-cytochrome c oxidase subunit 2. (B) Electron micrograph images of mitochondria of WM1158 melanoma cells treated for 4 hr with 200 nM Elesclomol (ELM), or only drug vehicle (DMSO), or not treated (60,000× magnification). Arrowheads point to the outer mitochondrial membrane, and arrows to the inner mitochondrial membrane (cristae).

