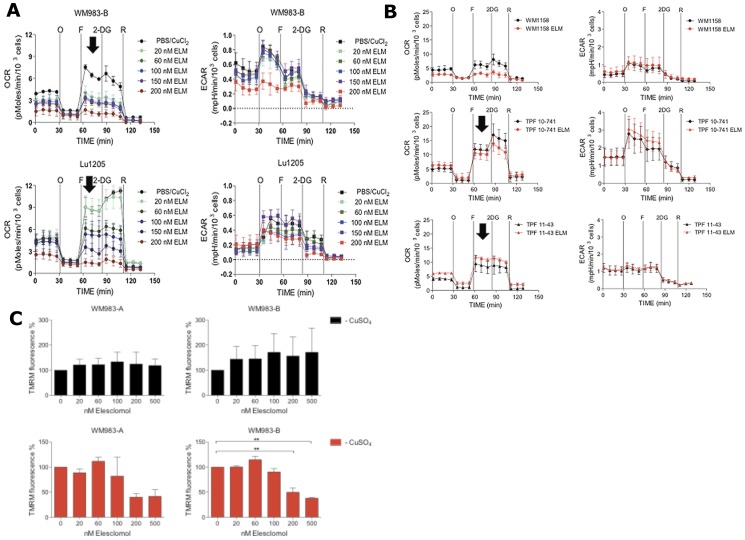
Figure 4. Bioenergetics analysis of melanoma cells.
(A) Seahorse XF24 Flux analysis of Lu1205 and WM983-B metastatic melanoma cells treated for 2 hr with increasing doses of Elesclomol salt (ELM) (20, 60, 100, or 200 nM). After baseline OCR and ECAR determination, the cells were treated with oligomycin (O), FCCP (F), rotenone (R), or 2-deoxyglycose (2DG). Melanoma cells sensitive to Elesclomol, which had low reserve capacity and could not upregulate oxygen consumption in response to FCCP, are indicated by arrows. (B) Seahorse XF24 analysis of WM1158 cells and Vemurafenib-resistant melanoma cell lines (TPF10-741; TPF11-43) treated for 2 hr with 200 nM of Elesclomol salt (ELM) or only PBS. (C) Analysis of mitochondrial membrane potential in WM983-A and WM983-B using TMRM fluorescence following increasing doses of Elesclomol salt (20, 60, 100, 200, 500 nM) in the presence or absence of copper (5 µM).

