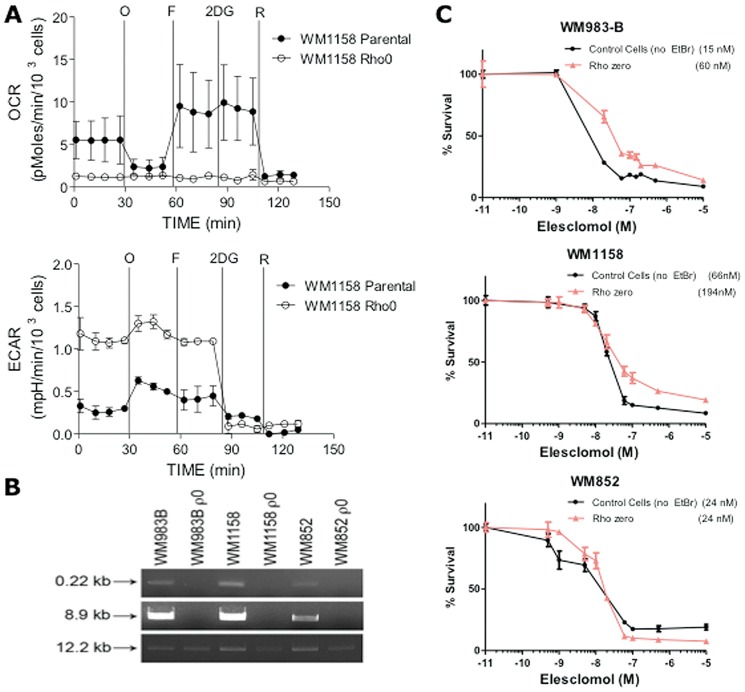
Figure 5. Analysis of ρ0 melanoma cells.
(A) Equal amounts of DNA isolated from each cell line (parental; ρ0) were analyzed by qPCR for a small (0.22 kb) mitochondrial sequence (primer set 14,620/14,841), a large (8.9 kb) mitochondrial sequence (primer set 5,999/14,841), and a 12.2 kb DNA polymerase β primer set serving as a positive control for nuclear gene expression [25]. qPCR samples not containing DNA or primer sets served as negative controls. (B) Pharmacologic profile of OCR and ECAR of parental (solid circles) and ρ0 (open circles) WM1158 melanoma cell lines as determined by the Seahorse X24 analyzer. (C) Three-day MTT proliferation analysis of WM1158, WM983-B, and WM852 ρ0 and parental cells (no ethidium bromide, EtBr).

