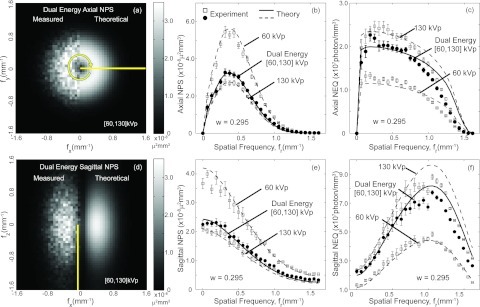
Figure 2.
Comparison of theoretical and measured NPS and NEQ from the [60, 130] kVp DE image and the associated single-energy images. The top row shows results in the axial (fx, fy) plane. An axial slice through the 3D NPSDE is shown in (a). The radial average of the 3D NPS and 3D NEQ for this axial plane are displayed in (b) and (c). The bottom row shows the sagittal (fx, fz) plane. A slice through the 3D NPS in the sagittal plane is shown in (d). Sagittal profiles of the single-energy and dual-energy NPS and NEQ are plotted in (e) and (f) as angular average of line profiles taken at a fixed radius (fz = 0.249 mm−1) from the fz axis. Theoretical predictions are shown as curves, whereas experimental results are shown as individual data points for (b), (c), (e), and (f). Reasonable agreement between theory and experiment was observed for both the single-energy and dual-energy results.

