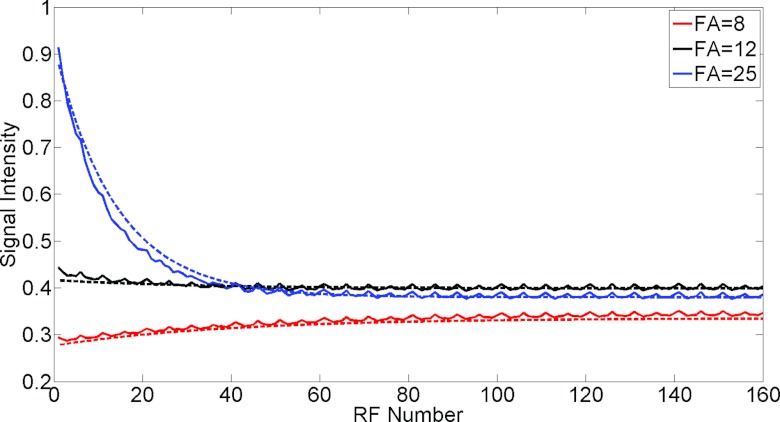
Figure 4.
The signal intensity changes with readout index acquired with TR = 2.5, SRT = 150 ms and the specified α of 8°, 12°, and 25° are shown by the solid lines, and the signal intensity is calculated by doing linear interpolation to obtain the k-space center for each ray. The dashed lines are calculated from Eq. 1 and manually fitted to the solid line. Lower flip angles: 6°, 9°, 18° are used to give better fits. These flip angles are closer to the actual flip angles (Ref. 30).

