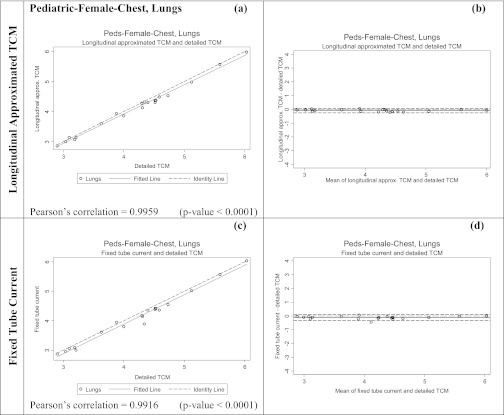
Figure 11.
Summary of the statistical analysis performed on the lung dose data for pediatric chest patient models in mGy. The graphs on the left are the scatter plots for each method, while the ones on the right are Bland-Altman graphs to show mean and standard deviation of the data. The x axis of the scatter plot shows lung dose in mGy from detailed TCM function (X1) and the y axis represents lung dose in mGy from either the longitudinal approximated TCM or fixed tube current (X2). The x axis of the Bland-Altman graphs is (X1+X2)/2 and the y axis represents (X2-X1). For both methods the means are very close to the y = 0 lines and the standard deviations are small.

