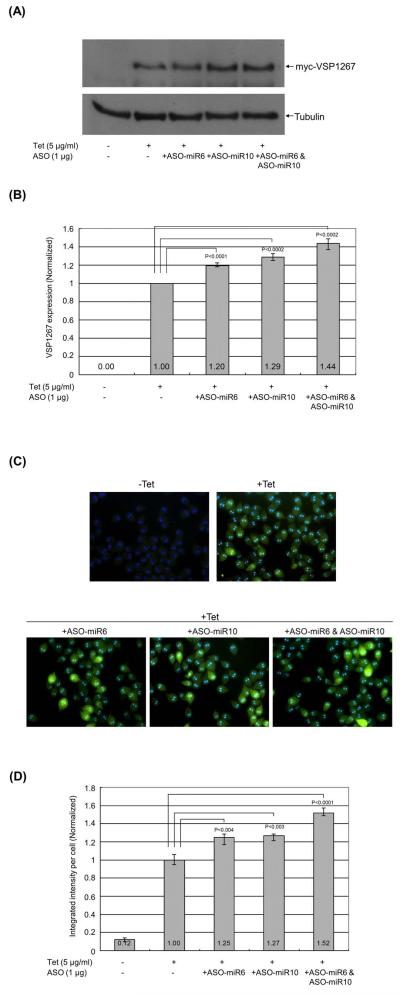
Figure 4. The ASOs of miR6 and miR10 can suppress the endogenously repressed myc-VSP1267 expression.
(A) The expression of myc-VSP1267 was detected by Western blot after introducing ASO-miR6 or/and ASO-miR10 into the trophozoites. The level of myc-VSP1267 protein was monitored by Western blot after a 16 hr incubation at 37°C. Five independent experiments were carried out. (B) The quantitative data on the expression of myc-VSP1267 without ASOs was set at 1. The p-values indicated were calculated by two-tailed Student’s t-test. (C) The immuno-fluorescence assay of Giardia trophozoites expressing myc-VSP1267 after introducing ASO-miR6 or/and ASO-miR10. The same cell samples used in Western blot analysis were used for immunostaining of myc-VSP1267. The cell images were taken and the mean integrated intensity of fluorescence per cell in each image was measured using the CellProfiler program (Lamprecht et al., 2007). For each sample, at least five images were taken. (D) The quantitative integrated intensity of fluorescence per cell was analyzed. The p-values indicated were calculated by two-tailed Student’s t-test.

