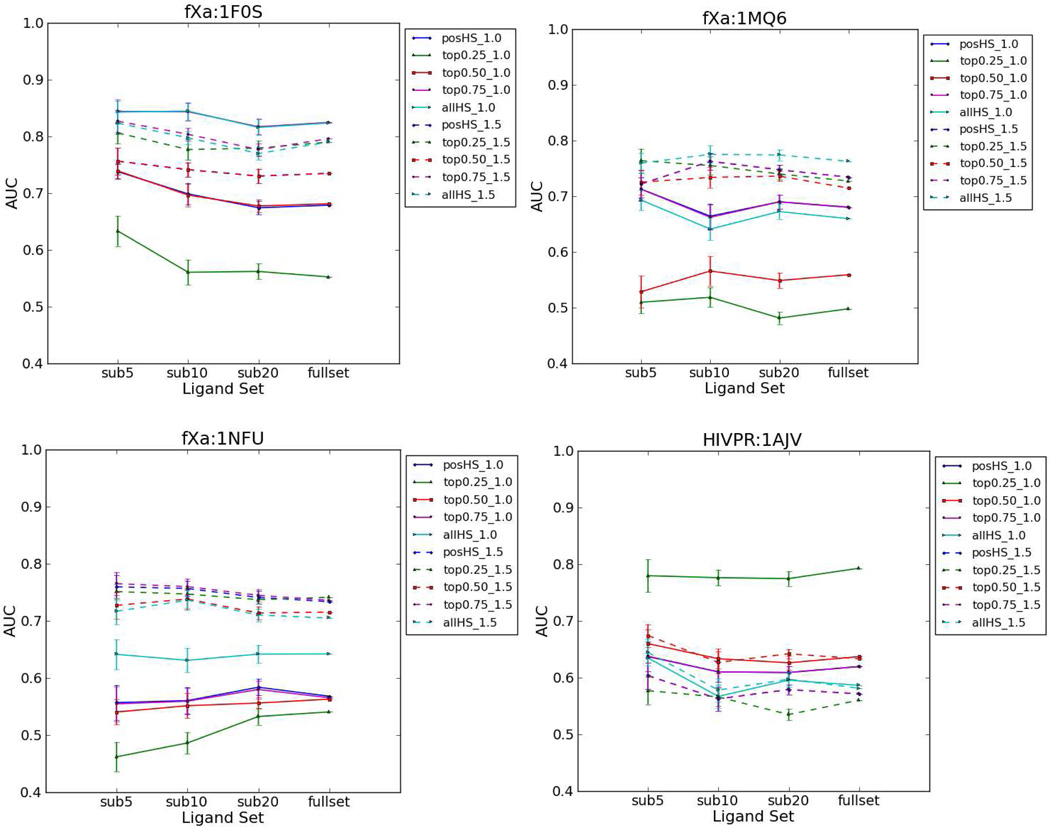
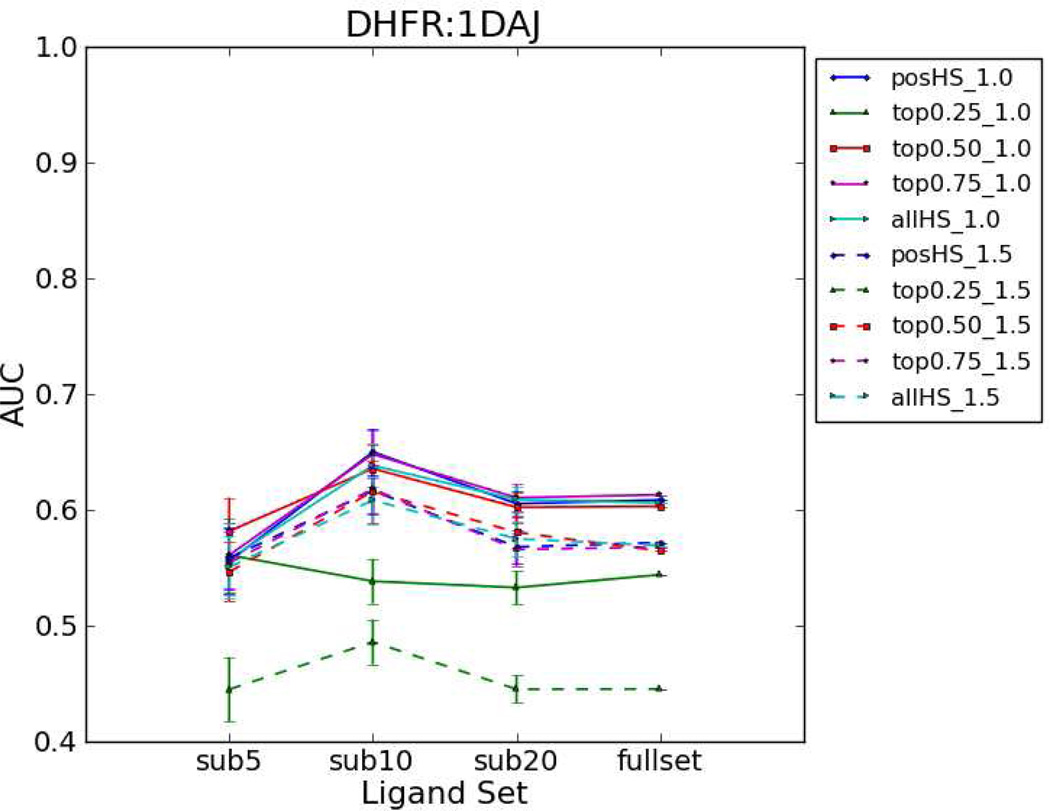
Figure 8.
AUC results use different hydration-site-restricted pharmacophore models to screen against random selected subsets. The AUC was plotted against each subset with 5 (sub5), 10 (sub10) or 20 (sub20) active ligands and the full DUD dataset. Results of the HSRP models using the 1.0 Å distance cutoff are shown using solid lines and that of the 1.5 Å cutoff are shown using dashed lines. For AUC of each subset, the standard error was computed on 20 randomly sampled ligand subsets.


