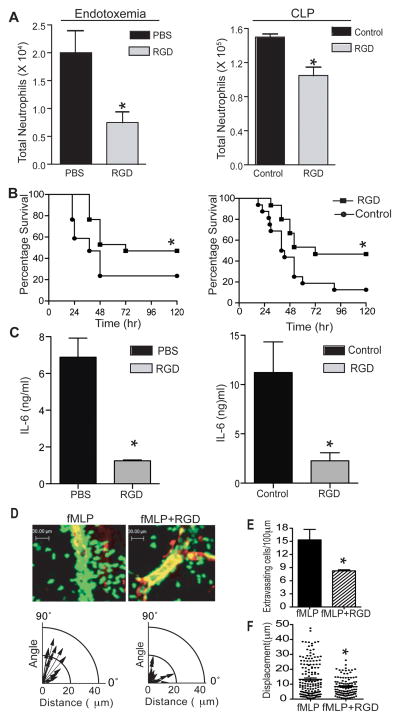
Figure 1. Administration of RGD peptide improves survival in sepsis.
(A) Cells were isolated from the PL of septic mice (8 hr after endotoxemia or CLP) injected with control or RGD peptides (200 μg/dose, IV). Anti-Ly6G and anti-CD11b antibodies were used to stain neutrophils. The bar graphs show the total number of neutrophils in the PL of endotoxemia (Left panel) and CLP (Right panel) animals (n=4). (B) Endotoxemia (Left panel) or CLP surgery (Right panel) was performed, and survival was analyzed using the Kaplan-Meyer log-rank test to compare control (n=17–21/group, p=0.019 and 0.025 in endotoxemia and CLP group respectively) mice. (C) Serum levels of IL-6 as measured by sandwich ELISA (8hr after CLP or LPS injection). The graph shows the IL-6 concentrations in endotoxemia (left) and CLP (Right) mice treated with control or RGD peptide (n=6/group for CLP and 3/group for endotoxemia). (D) The effect of RGD peptide on neutrophil migration in vivo was assessed by intravital MP-IVM in the fMLP-superfused cremaster vessels of LysM-GFP mice after IV injection of control or RGD (200 μg). The lower panels show the track of extravasating neutrophils in each group. The polar coordinate shows the relation between the angles against the blood vessel and migrating distance of extravasating cells. (E) The bar graphs show the number of extravasating neutrophils per 100 μm of vessel length in each group. (F) Displacement (distance between the first and last track point of individual cells) was analyzed with Velocity software. Each dot represents the displacement of each extravasating cell. The MP-IVM data in Fig. (E) and (F) represents the combined results from three independent imaging experiments. At least five vessels were analyzed from three animals. The results in (A), (C), (E), and (F) are expressed as the mean ± SEM. * p<0.05.

