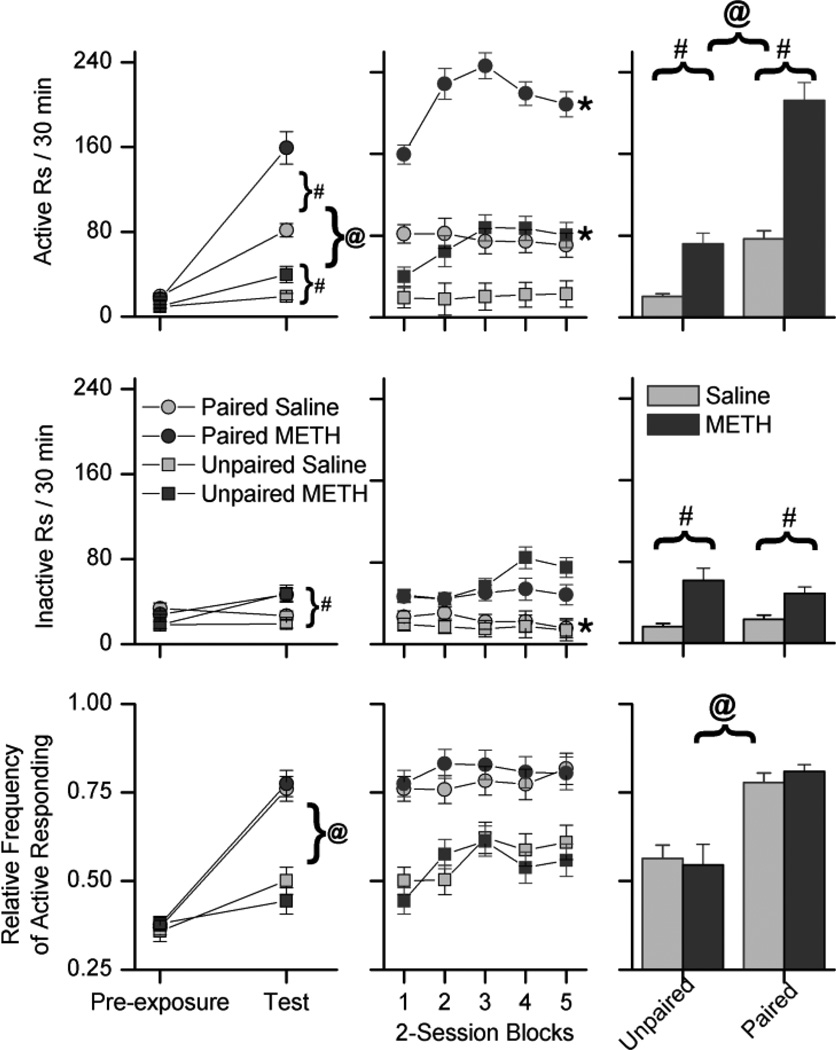
Fig. 3.
These plots depict active (top), inactive (middle), and the relative frequency of active responding (bottom) for the paired and unpaired groups. The left column depicts the last two-sessions of the pre-exposure phase and responding during the first two-sessions of the test phase, the middle column depicts responding during the testing phase, and the histograms in the right column show the 10-session averages of responding during the testing phase. Each data point represents the average number of responses made per session, averaged over two sessions. Circles indicate responding in the paired group, and squares indicate responding in the unpaired group. Light gray symbols indicate rats treated with saline, and dark gray symbols indicate rats treated with 0.5 mg/kg methamphetamine (METH). Pound (#) signs indicate significant differences between saline and METH treated rats, and ampersats (@) indicates significant differences between the paired and unpaired groups. In the middle column, asterisks (*) indicate significant differences between the first two-session block of testing and the last two-session block of testing. The data are expressed as means and the standard error of the means.

