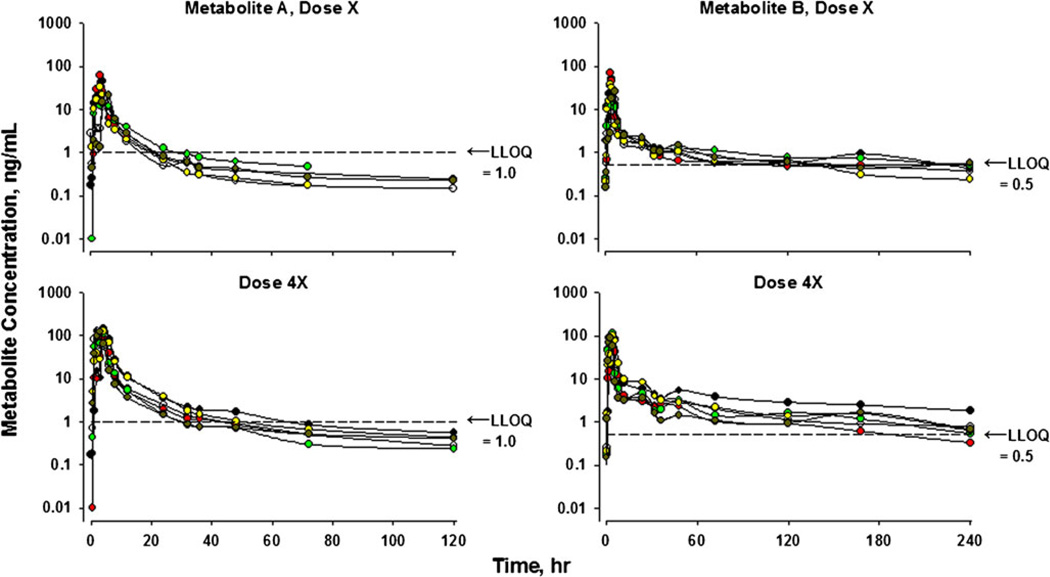
Fig. 2.
Time course of plasma concentrations of two drug metabolites following an oral dose of the parent drug in parallel group studies using six healthy volunteers at each dose level. The top panels depict data at Dose X while the bottom panels reflect Dose 4X. Measurements were made using a validated LC/MS/MS assay with the indicated LLOQ for each compound.

