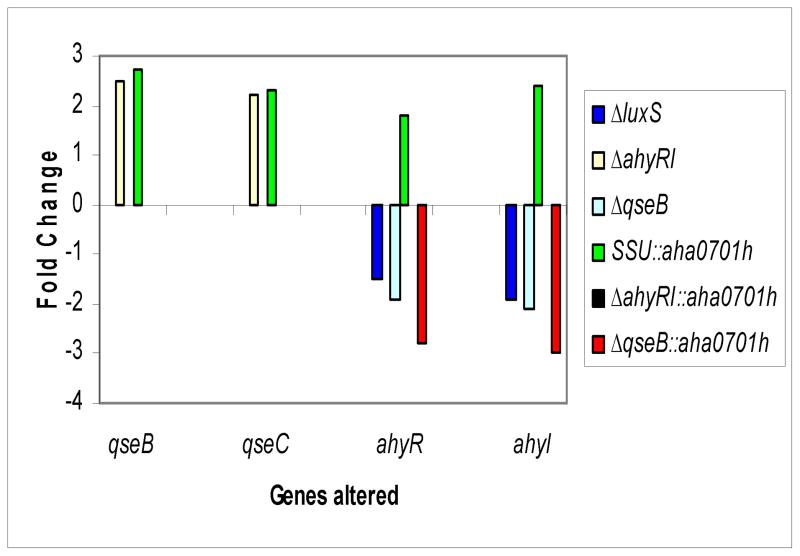
Fig. 6.
Comparison by RT-PCR of the expression of qseB, qseC, ahyR, and ahyI genes in different genetic backgrounds of A. hydrophila SSU. The transcript levels of the qseB and qseC genes were increased in the ahyRI mutant compared to those of the WT A. hydrophila (yellow bars). The qseB and qseC gene transcript levels were increased when c-di-GMP was overproduced in the WT A. hydrophila compared to those of the parental strain with pBAD/Myc-HisB vector (green bars). The level of expression of the ahyR and ahyI genes was down-regulated in the ΔluxS mutant. The transcript levels ahyR of the and ahyI genes were down-regulated in the ΔqseB mutant (cyan bars). The increased levels of c-di-GMP further down-regulated the expression levels of ahyR and ahyI genes in the ΔqseB mutant (red bars). Finally, the expression ahyR of the and ahyI genes was increased in the WT A. hydrophila with increased c-di-GMP levels (green bars). The data used to generate fold changes (arithmatic means ± standard deviations) with statistical analysis are shown in Supplemental data, Table I.

