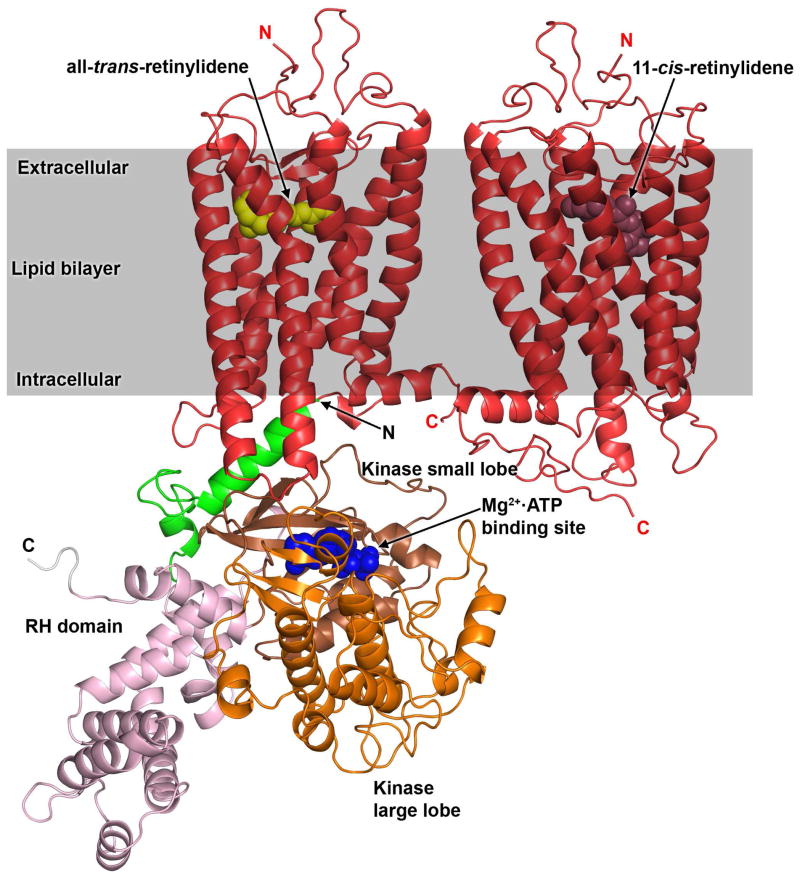
Figure 1. Model of the Rho–GRK1 complex.
GRK1 modeled in a closed conformation with an ordered N–terminal helix is docked to Rho* using the C–terminal helix of Gαs present in the β2AR–Gs crystal structure as a guide 16, 33. The coordinates for the model, in Protein Data Bank format, are available upon request. Positions of the ordered N– and C–termini are labeled with N and C, respectively. Domains of GRK1 are represented as follows: N–terminus region (Ser1–Pro42) in green, the RH domain in pink (Pro43 to Glu184 and Trp515 to Arg532) and the kinase domain small lobe in brown (Asp185 to Asn268) and large lobe in orange (Gly269 to Pro514). The C–terminal region of GRK1 is shown in gray. The GRK1 model was constructed using a homology modeling strategy based on the X–ray of the GRK6 structure 15. The expected position of the lipid bilayer relative to the Rho*–GRK1 complex is illustrated by the grey rectangle. In this cartoon, a theoretical Rho*–Rho heterodimer is shown in red, based on the recently modeled H8–H8 dimer orientation, although monomeric Rho is also an efficient substrate for GRK1 in vitro 34–36. All–trans–retinylidene and 11–cis–retinylidene are depicted using yellow and brown spheres, respectively.

