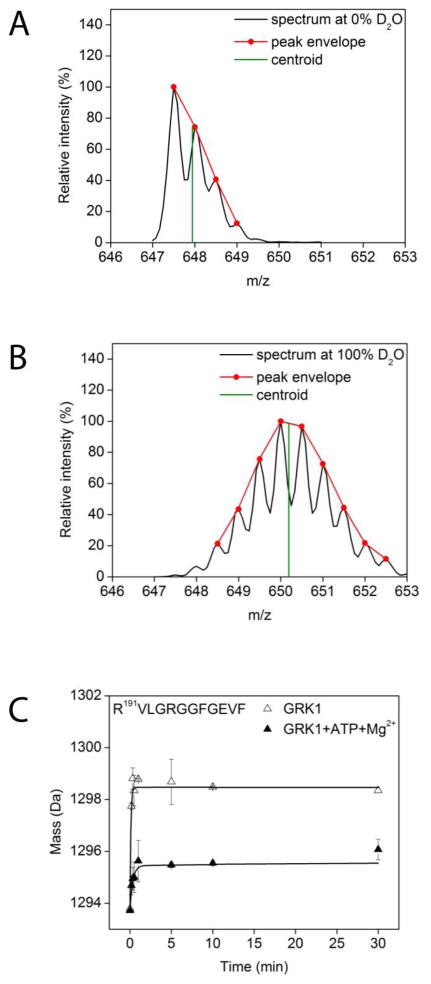
Figure 3. Typical workflow for evaluation of hydrogen–deuterium exchange.
(A) The spectrum of a doubly charged peptide with the sequence R191VLGRGGFGEVF. For illustration purposes, the peak envelope is shown in red whereas the centroid calculated by using the algorithm described in Experimental Procedures is shown in green. (B) The same peak at the same retention time as the undeuterated species in (A). (C) Typical deuterium uptake of the R191VLGRGGFGEVF peptide under two different experimental conditions. The absolute mass of the R191VLGRGGFGEVF peptide as a function of incubation time is shown by the open triangles for apo–GRK1 and closed triangles for Mg2+·ATP loaded GRK1.

