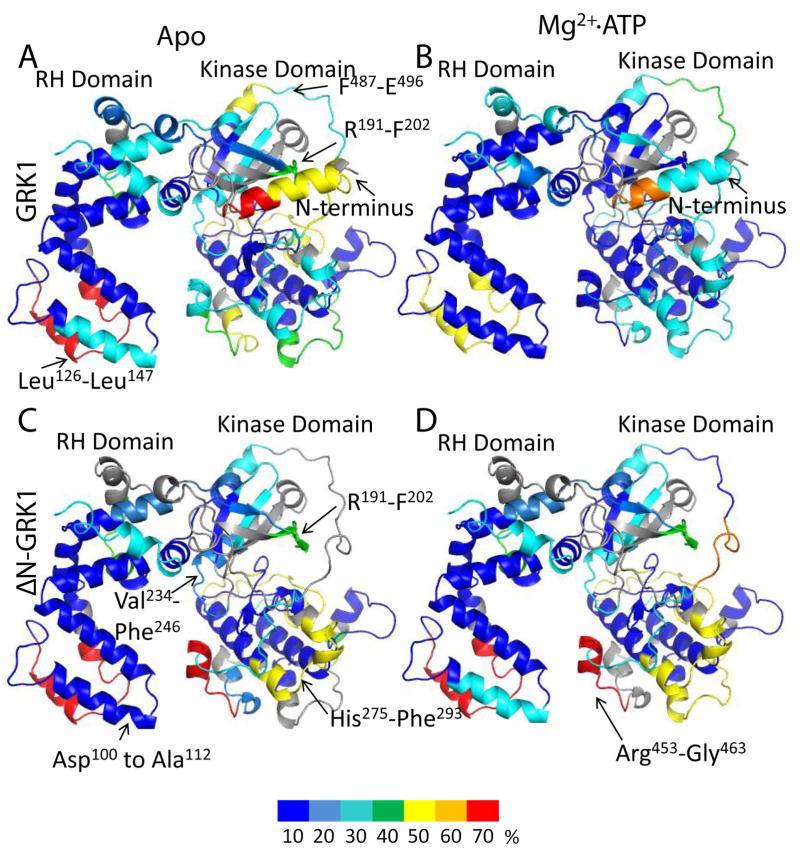
Figure 4. Normalized hydrogen–deuterium uptake by GRK1 and ΔN–GRK1.
Color coding based on the normalized deuterium uptake was mapped onto the three dimensional model of GRK1 as described in the “Molecular modeling” section. Color coding is as described in Fig. 2. For ΔN–GRK1, the N–terminal helix was removed from the model. The normalized deuterium uptake for (A) apo–GRK1, (B) GRK1 in the presence of Mg2+·ATP, (C) apo–ΔN–GRK1, and (D) ΔN–GRK1 in the presence of Mg2+·ATP. Regions are colored grey where uptake was not determined because it was either below the detection threshold or peptide signals overlapped.

