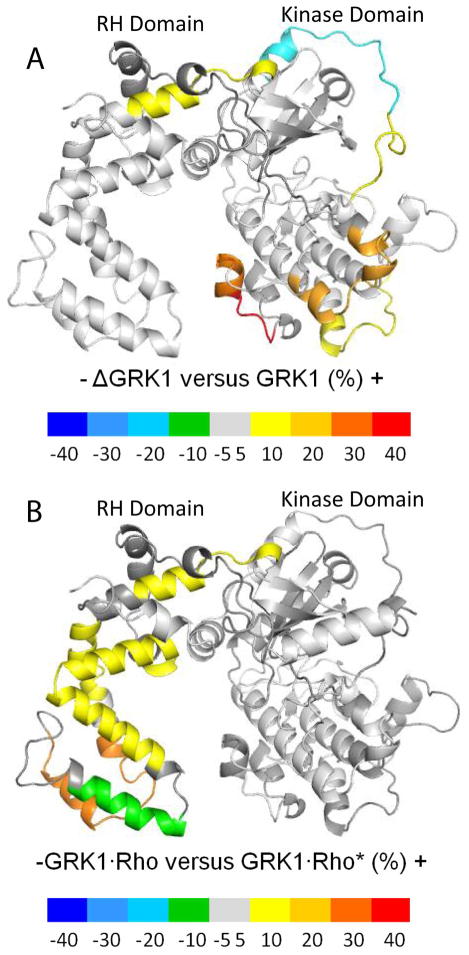
Figure 8. Differences in normalized hydrogen–deuterium exchange.
(A) Differences in normalized deuterium uptake between ΔN–GRK1 and apo–GRK1. (B) Differences in normalized deuterium uptake between GRK1 in the presence of either Rho or Rho*. Color coding was assigned based on the value of the difference between the normalized deuterium uptake values between the states shown. Negative differences (associated to blue, cyan, light blue, and green) denote higher uptake in the case of GRK1 (panel A) or when Rho* is present (panel B). Positive differences (associated to yellow, orange, and red) denote higher uptakes in ΔN–GRK1 (panel A) or when Rho is present (panel B). Regions that have absolute differences less than 10% or were not included in the analysis are depicted in grey.

