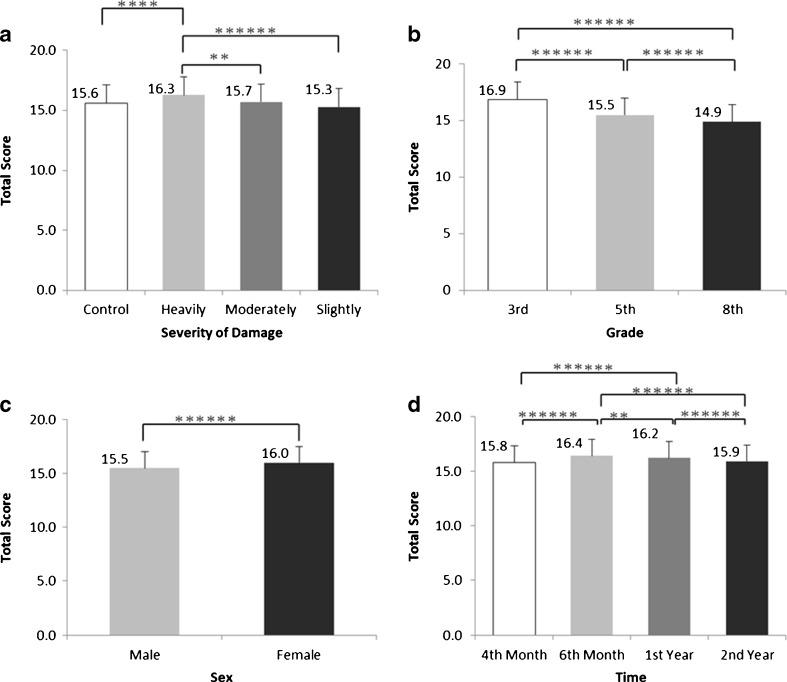
Fig. 3.
Cluster analysis of the total scores of factor 2 (depression and physical symptoms) in terms of the extent of the disaster that the children experienced (a), the children’s grade (b), their sex (c), and the length of time after the earthquake (d). Each class is handled as a unit, and data are expressed as mean ± SD; *p < 0.05, **p < 0.01, ***p < 0.005, ****p < 0.001, *****p < 0.0005, ******p < 0.0001

