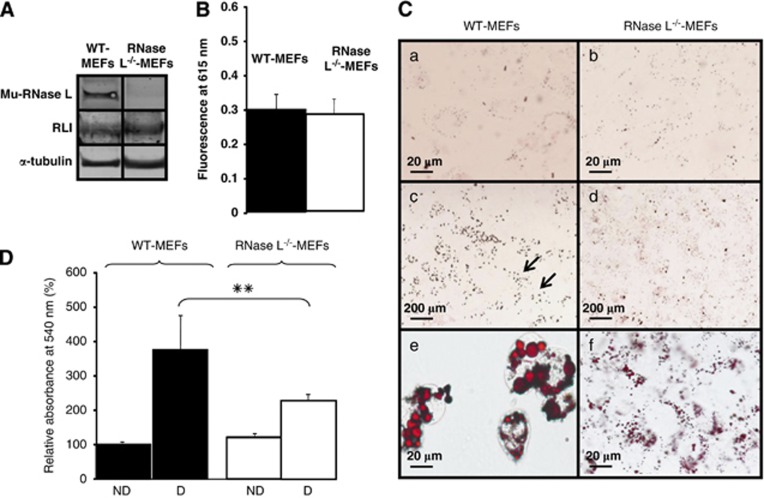
Figure 1.
RNase L and RLI expression, viability and lipids accumulation in WT-MEFs and RNase L−/−-MEFs. (A) WT-MEFs and RNase L−/−-MEFs proteins were analyzed by western blot with antibodies against mouse RNase L and mouse RLI. α-tubulin antibody was used as an indicator of proteins quantity loading. (B) Cells viability was measured in WT-MEFs and RNase L−/−-MEFs by measuring fluorescence emission at 615 nm of PrestoBlue reagent reduced by living cells. Error bars refer to the S.D. obtained in four independent experiments. (C) WT-MEFs and RNase L−/−-MEFs were induced to differentiate in ADM. Cells were fixed and stained with oil red O to reveal lipids accumulation at day 0 (a and b) and after 6 days of differentiation (c–f). Cells were observed at a magnification of × 40 (a, b, e and f) or × 5 (c and d). Arrows in (c) indicate groups of differentiated cells observed at upper magnification in e. (D) After staining with oil red O, lipids were quantified in WT-MEFs and RNase L−/−-MEFs at day 0 (ND) and day 6 after induction of adipocyte differentiation (D) by spectrophotometric analysis at 540 nm, following elution of cell retained oil red O with ethanol. The amount of lipids in WT-MEFs at day 0, was set to 100%. Error bars refer to the S.D. obtained in four independent experiments conducted in duplicate. **P=0.009 RNase L−/−-MEFs compared with WT-MEFs at day 6

