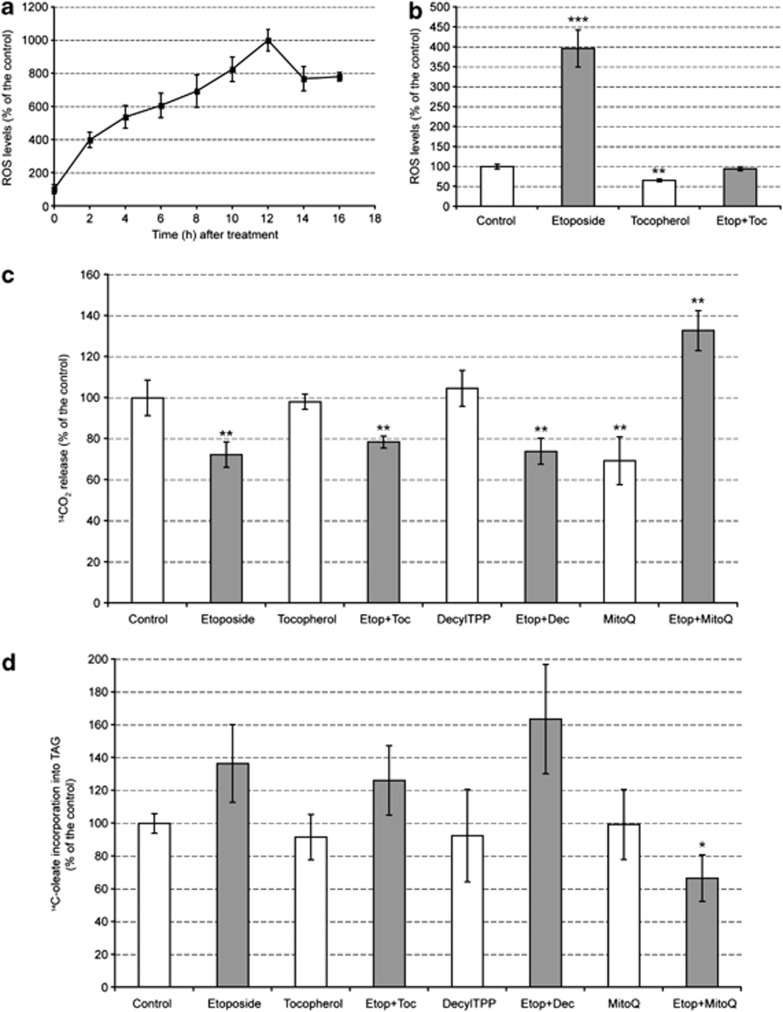
Figure 6.
Apoptosis induction increases the levels of ROS in the cell. (a) ROS levels were measured by flow cytometry after staining the cells with carboxy-H2DCFDA and are expressed as the percentage increase in median fluorescence compared to untreated controls (mean±S.E.M.; P<0.005 in all points, n=6). (b) Cells were pretreated for 1 h with 9.5 μg/ml tocopherol (Toc), after which etoposide (Etop) was added into the cell medium for a further 2 h and then the cells were harvested. Results were expressed as the percentage of the values in control cells (mean±S.E.M., n=3). (c) 14C-oleate was added to cells 1 h before harvest to assess β-oxidation. Results are expressed relative to the level of oxidation in control cells as the mean±S.E.M., n=6. (d) The lipid fraction was obtained from cells treated as in (c) and densitometric analysis of autoradiographs of thin layer chromatography (TLC) plates was used to assess oleate incorporation into TAG, as described in Materials and methods. In (c) and (d), 1 μM MitoQ, 1 μM DecylTPP (Dec) or 9.5 μg/ml tocopherol were added to the cells 1 h before adding 15 μM etoposide and the cells were then incubated for a further 2 h. Dec was used to control for the effect of the triphenylphosphonium ion on mitochondrial function. Results are expressed as percentage of incorporation relative to untreated controls (mean±S.E.M., n=6). Significantly different from control at: *P<0.05, **P<0.01, ***P<0.001

