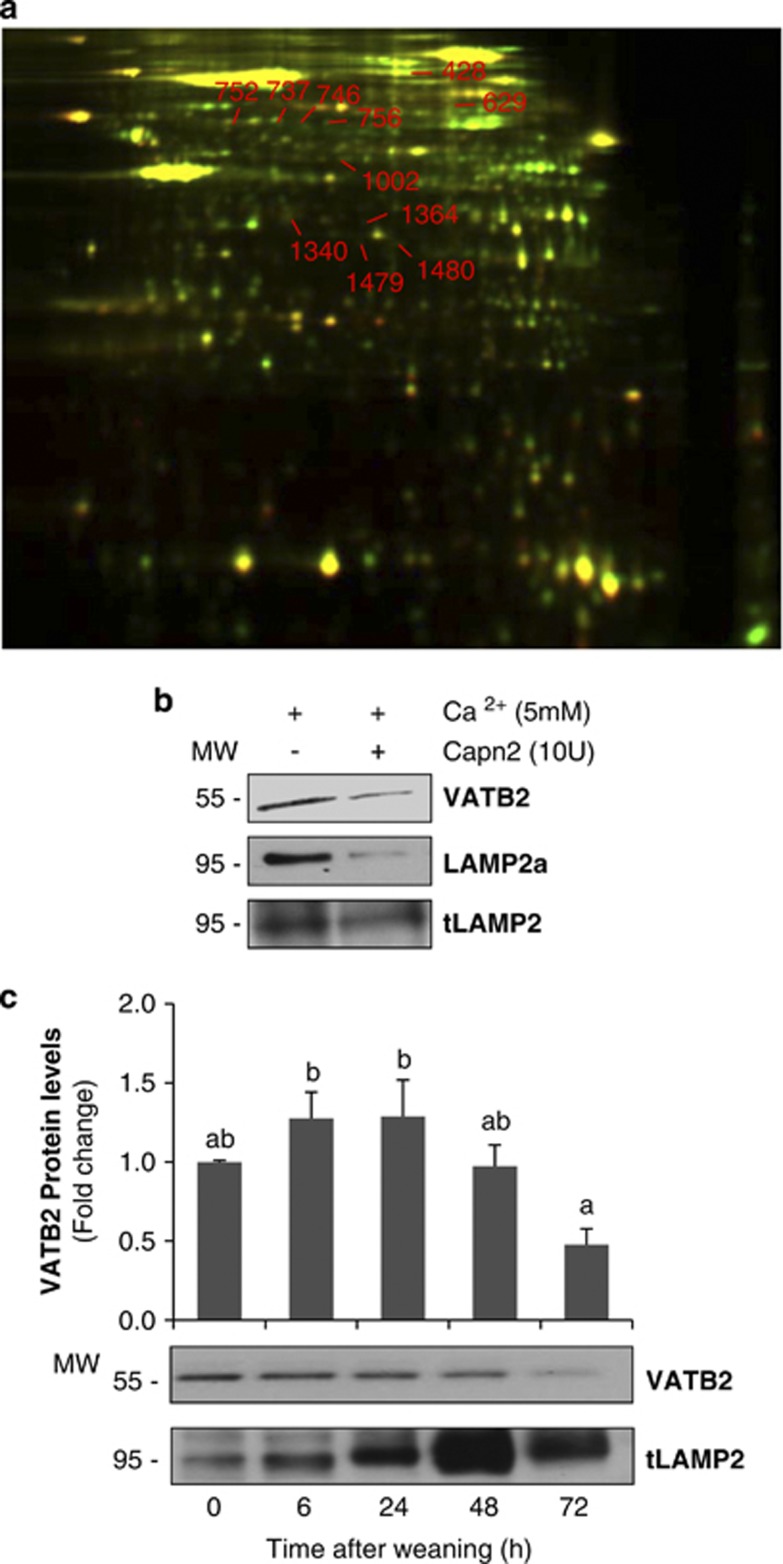
Figure 6.
2D DIGE analysis of calpain-mediated proteolysis in lysosomal extracts. (a) The lysosome fraction from control lactating mammary gland was treated with (green) or without (red) recombinant calpain 2 (10 units) for 1 h at 37 °C. Dye-labeled samples were combined, and the protein mixture was separated subsequently in two dimensions. Proteins were reduced in abundance following calpain treatment (i.e. calpain substrates) appear green. Protein spots resistant to calpain digestion appear yellow. The numbered spots were excised and identified by mass spectrometry. (b) Immunoblot for v-type H+ ATPase subunit b2 (VATB2), Lamp2a (anti-cytosolic) and total Lamp2 in samples used for proteomic analysis. (c) Western blot for VATB2 in mammary gland lysosomal extracts at different times of involution (0, 6, 24, 48 and 72 h). Total Lamp2 was used as a lysosomal marker. Immunoblot is representative of three different experiments. For quantification, all values are means±S.E.M. ANOVA was performed for the statistical analysis, and different superscript letters indicate significant differences, P<0.05; the letter ‘a' always represents the lowest value within the group

