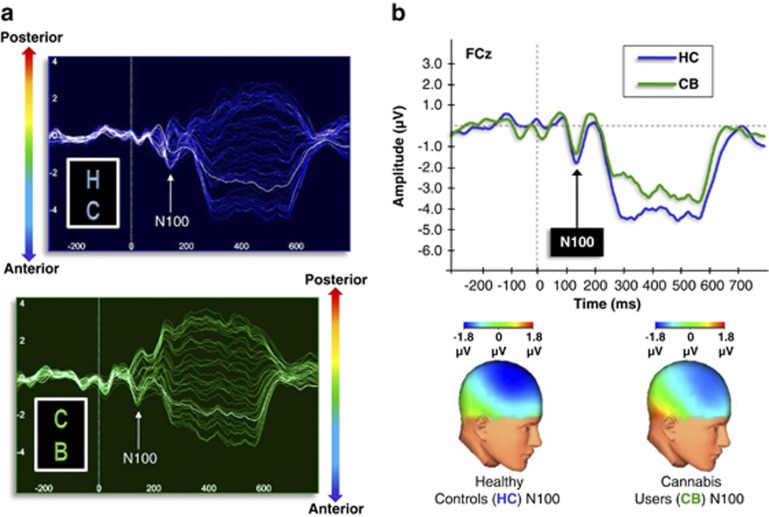
Figure 3.
(a) Butterfly plots illustrating the grand-averaged ERPs across all electrodes during 40 Hz stimulation for healthy controls (HC) and cannabis users (CB). Waveforms from each source electrode are oriented generally from posterior (top) to anterior (bottom). (b) Grand-averaged ERPs (FCz) and topographic maps (at 100 ms) for healthy controls and cannabis users demonstrating the N100 to 40 Hz stimulation (top). No group differences were observed in the N100 component in any frequency condition, indicating normal early stimulus processing and registration.

