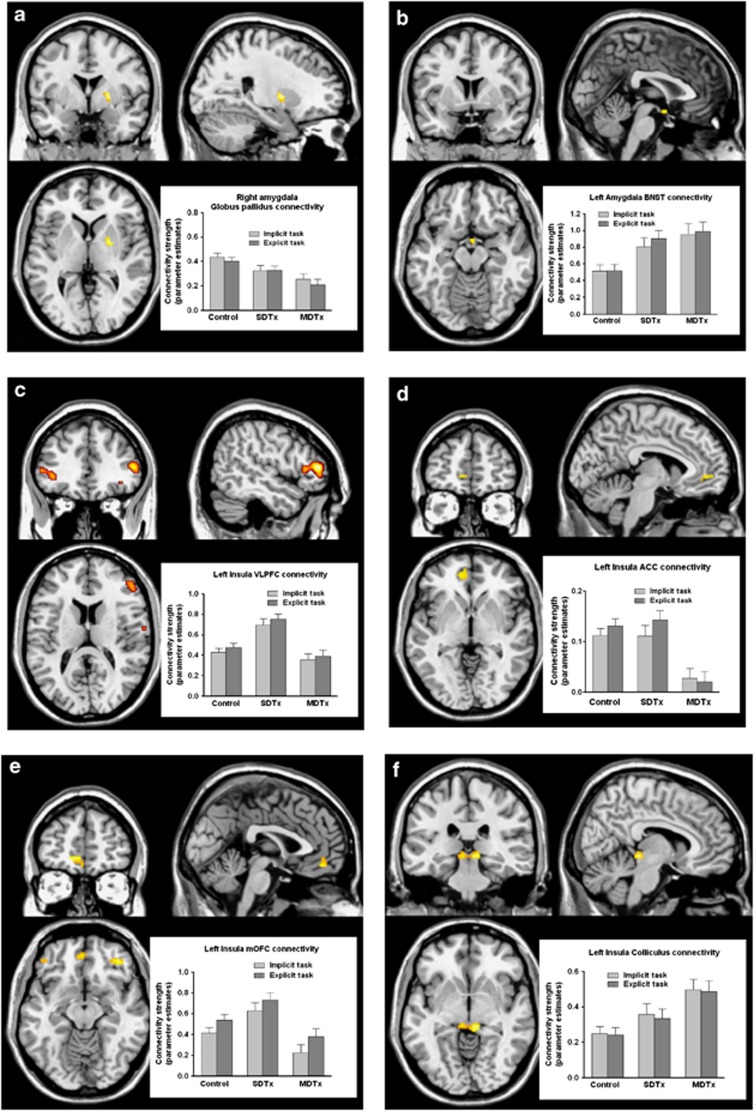
Figure 2.
Brain regions showing a group effect in connectivity of amygdala (a, b) and insula (c–f) as seed chosen regions. For display purposes, maps are shown at an uncorrected threshold of p<0.001. Bar graphs depict changes of BOLD signal in the different groups for implicit and explicit condition for connectivity between right amygdala and right globus pallidus (a), left amygdala and right BNST/hypothalamus (b), left insula and right VMPFC (c), left insula and left anterior cingulate cortex (d), left insula and left orbitofrontal cortex (OFC) (e), and left insula and right colliculus (f). MDTx, multiply detoxified; SDTx, singly detoxified; VMPFC, ventromedial PFC

